
1
Workday Adaptive Planning – User Guide
Budgeting Input Process and Documentation
Prepared by the:
Updated April 2023

2
Contents
Introduction .................................................................................................................................................. 4
System Installation Instructions .................................................................................................................... 4
Login Information.......................................................................................................................................... 4
System Description – Sheets, Workflow and Model..................................................................................... 5
The Top Toolbar .................................................................................................................................... 5
The Navicon .......................................................................................................................................... 5
Versions, Levels and Sheets .......................................................................................................................... 6
1. Versions ............................................................................................................................................. 6
2. Sheet Structure ................................................................................................................................. 7
a. Standard Sheets .......................................................................................................................... 10
b. Modeled Sheets .......................................................................................................................... 14
c. Cube Sheets ................................................................................................................................ 15
1. Entering the Budget or Actuals ........................................................................................................... 16
(step by step instructions) .......................................................................................................................... 16
1) Income Statement Sheet (Input) Sheet ................................................................................... 18
2) Balance Sheet (Input) Sheet ...................................................................................................... 18
3) Revenue and Utilization Steps .................................................................................................. 19
Hospital and Physician Revenue (Input) Sheet no longer linked to the Income Statement ................... 19
a. Input--Inpatient and Outpatient Statistic /Utilization information ................................................ 23
4) Payer Revenue (Input) Sheet - no longer linked to the Income Statement .................................... 24
5) Other Revenue (Input) Sheet .......................................................................................................... 25
6) Expenses (Input) Sheet - no longer linked to the Income Statement. .................................... 25
7) Staff/FTE (Input) Sheet .............................................................................................................. 25
8) Capital ............................................................................................................................................ 27
Non-CON and CON Capital Detail ....................................................................................................... 27
a. Non-CON Detail (Input) Sheet ................................................................................................... 28
b. CON Capital Detail (Input) Sheet .............................................................................................. 28
c. Capital Summary (Partial Input) Sheet ................................................................................... 29
9) Percent Change in Charge (previously called Rate) (Input) Sheet (Budgets only) ........ 29
Outputs generated from your Input (please review) ................................................................... 29
Cash Flow Sheet (only use for Actuals submissions) .............................................................................. 29

3
Cost Shift Sheet ....................................................................................................................................... 30
Statistic Metrics Sheet ............................................................................................................................ 31
Utilization Sheet ...................................................................................................................................... 31
Viewing Edits and Reports for input validation .......................................................................................... 32
Submitt (upload) your actual or budget reports ......................................................................................... 36
SUBMIT your Budget or Actuals .................................................................................................................. 39
RATIOS, STATISTICS, AND INDICATORS ................................................................................................... 40
GLOSSARY................................................................................................................................................ 46

4
Introduction
System Installation Instructions
Since Workday Adaptive Planning is a web-based tool, there is no required software to install locally.
However, new for this year, we are rolling out an optional Excel Planning add-on. This will allow users to
interact with Adaptive sheets through an Excel interface.
The latest version of the add-on is available at:
https://clickonce.adaptiveinsights.com/planning/latest/WorkdayAdaptivePlanningExcelSetup.exe
WORKDAY ADAPTIVE PLANNING REPORTING
GMCB has deployed Workday Adaptive Planning as the system and Database to manage the submission
and review of all budget data and for analysis of historical trends and financial results.
This document is split into two main sections, the first gives you an overview of all elements of the
system and the second will walk you through the steps needed to enter your budgets.
System Overview and Training
Login Information
Workday Adaptive Planning is a cloud-based budgeting solution. All interaction with the budget
planning model canl be done online through the following path:
Navigation: https://login.adaptiveinsights.com/app
This will bring you to a login screen and prompt you for your username and password. Enter this info
and select submit. Your username and password will be provided to you directly by the Green Mountain
Care Board staff. Note: Bookmark your login page.
5
System Description – Sheets, Workflow and Model
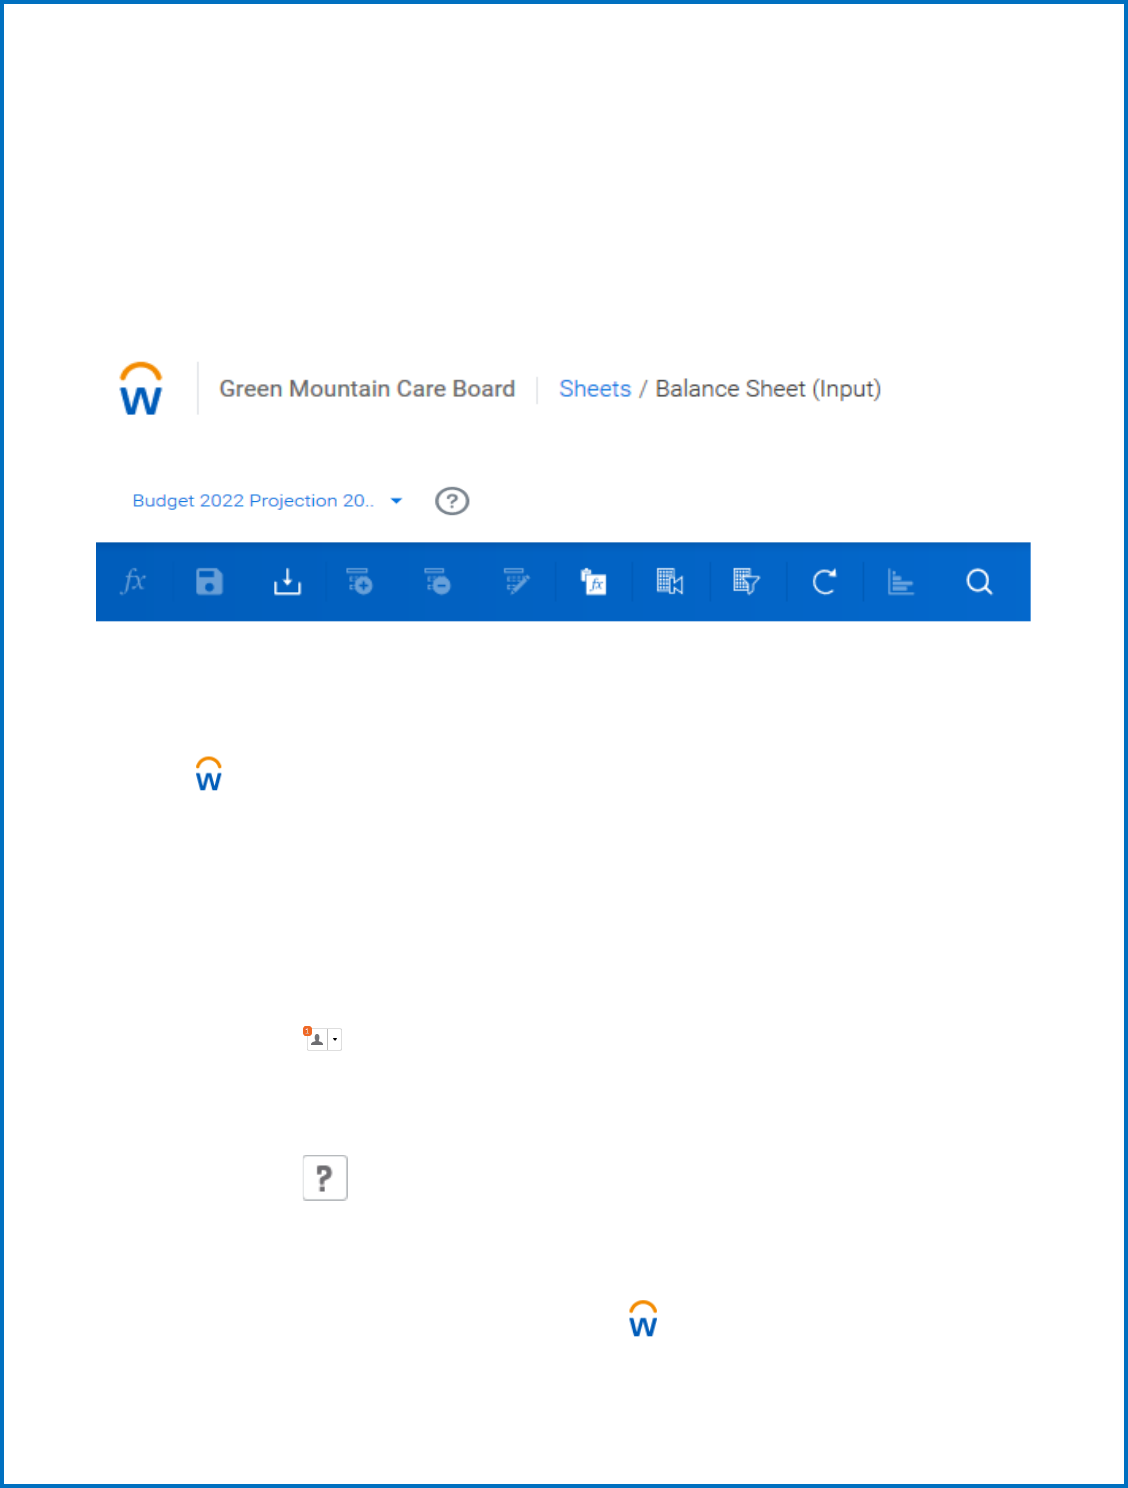
The Top Toolbar
Every screen in Adaptive Planning has the same toolbar across the very top
of the screen, as shown in Figure 1.
Figure 1: The top toolbar.
The sections of the top toolbar, from left to right, are:
•
: opens the navigation menu.
•
Breadcrumbs: This shows you what section of Planning you are in. In
Figure 2, the user is viewing the Balance Sheet, in the Sheets section.
•
Workday Adaptive Planning logo: Click to return to your home page.
•
Company logo: In this case, our sample company’s logo. Varies by instance.
•
Version selector: This drop-down menu lets you switch between
versions to which you have access. For more on versions, see
“Understanding Versions” on page 21.
•
User menu: Click the silhouette to see what other users (if any) are
currently in the database. Click the drop-down menu next to the
silhouette to show the user menu. From the user menu, you can change
your profile settings (click Settings) or log out (click Log out).
•
Online help : Click to open Adaptive Planning online help.
The blue toolbar beneath the top toolbar in Figure 2 is the sheet toolbar.
The Navicon
The central navigation for Adaptive Planning is the navicon
. To use the
navigation menu, click or mouse over the navicon. To see any of the secondary menus,
6
mouse over the arrow icon in the menu item’s line. For example, to see a list of
sheets available to you, mouse over the arrow icon across from Sheets in the menu.
The items on the dropdown that you see will vary based on your role and access you
are granted in the system.
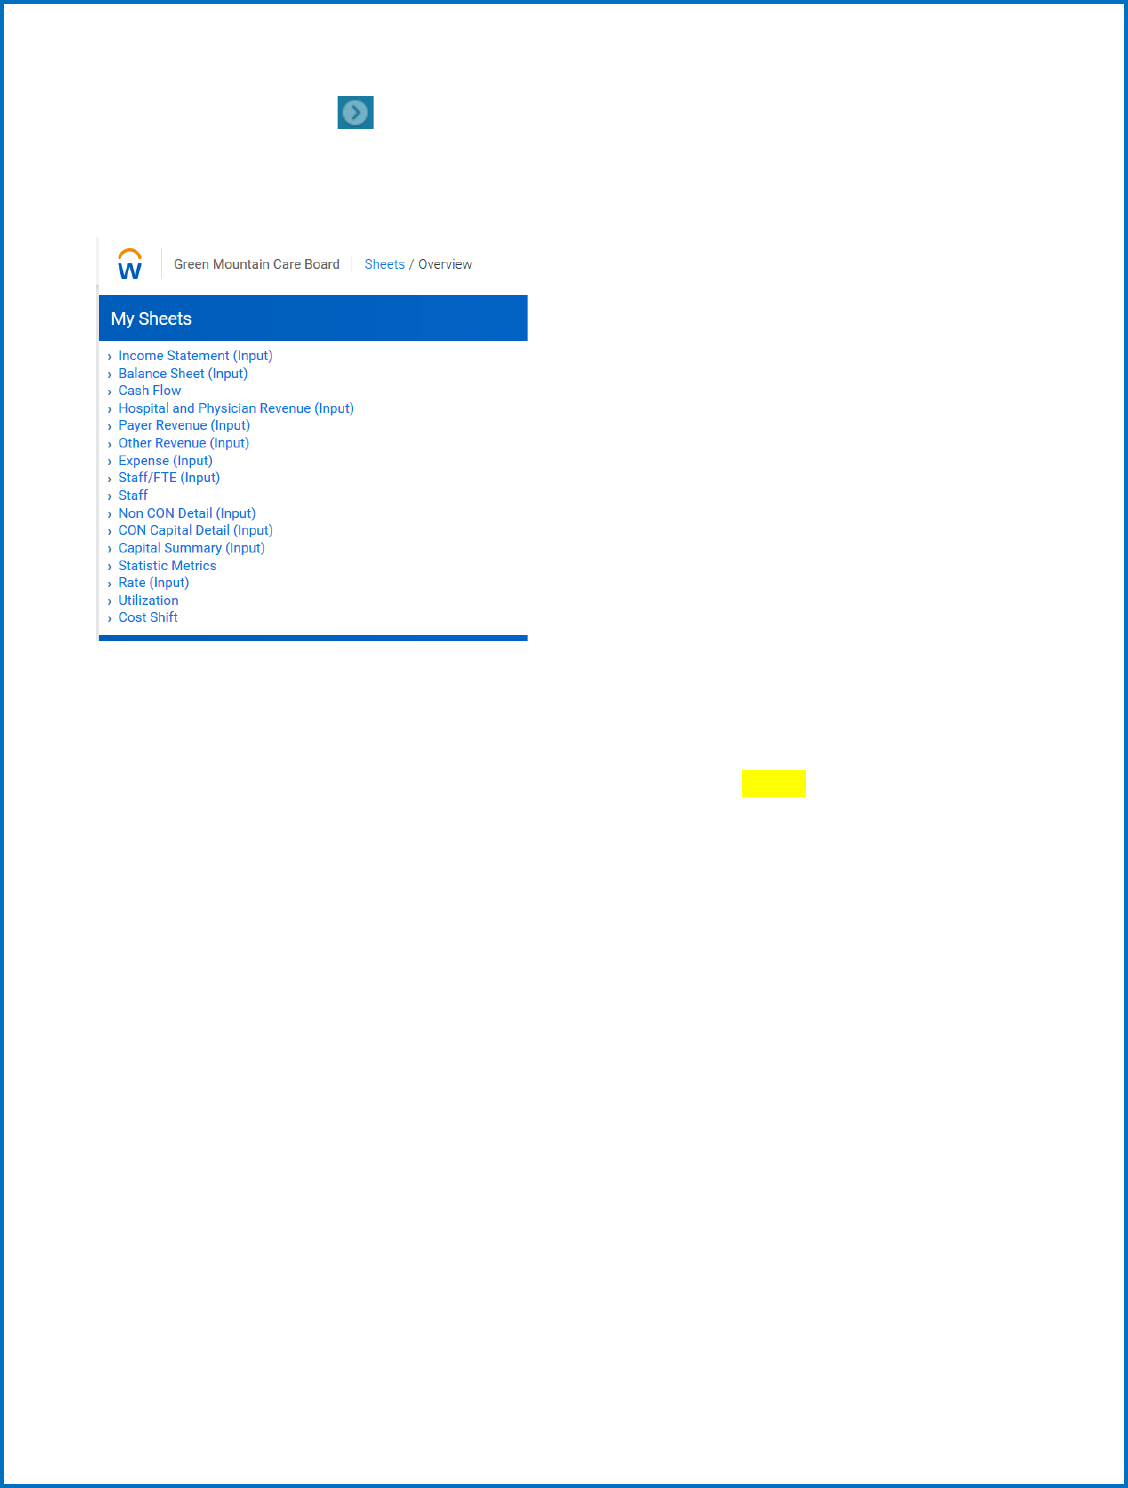
Most of your time will probably be spent in “SHEETS” and “REPORTS”. You will input your budget by
selecting from the dropdown under the “SHEETS” option, and you will run reports to help you view the
results of your input by selecting from the dropdown under the “REPORTS” option. Once you are
finished with input, you will select “OVERVIEW” from the dropdown to “Submit” your budget, but we
will explain that to you later in this document.
Versions, Levels and Sheets
The Sheets tab is where you will do the actual work to enter your budget. The example screenshot
below is what you will see on the Sheets tab. All these sheets can be clicked on to bring up a part of the
budget to be edited. Each sheet that requires data entry will be labeled with (INPUT) after the sheet
name.
Definitions for the accounts in the individual sheets are provided in the Uniform Reporting Manual
(URM) in the following directory located in Adaptive: Shared Reports>FY YYYY Budget>HOSPITAL
DIRECTORY>HOSPITAL BUDGET INSTRUCTIONS.
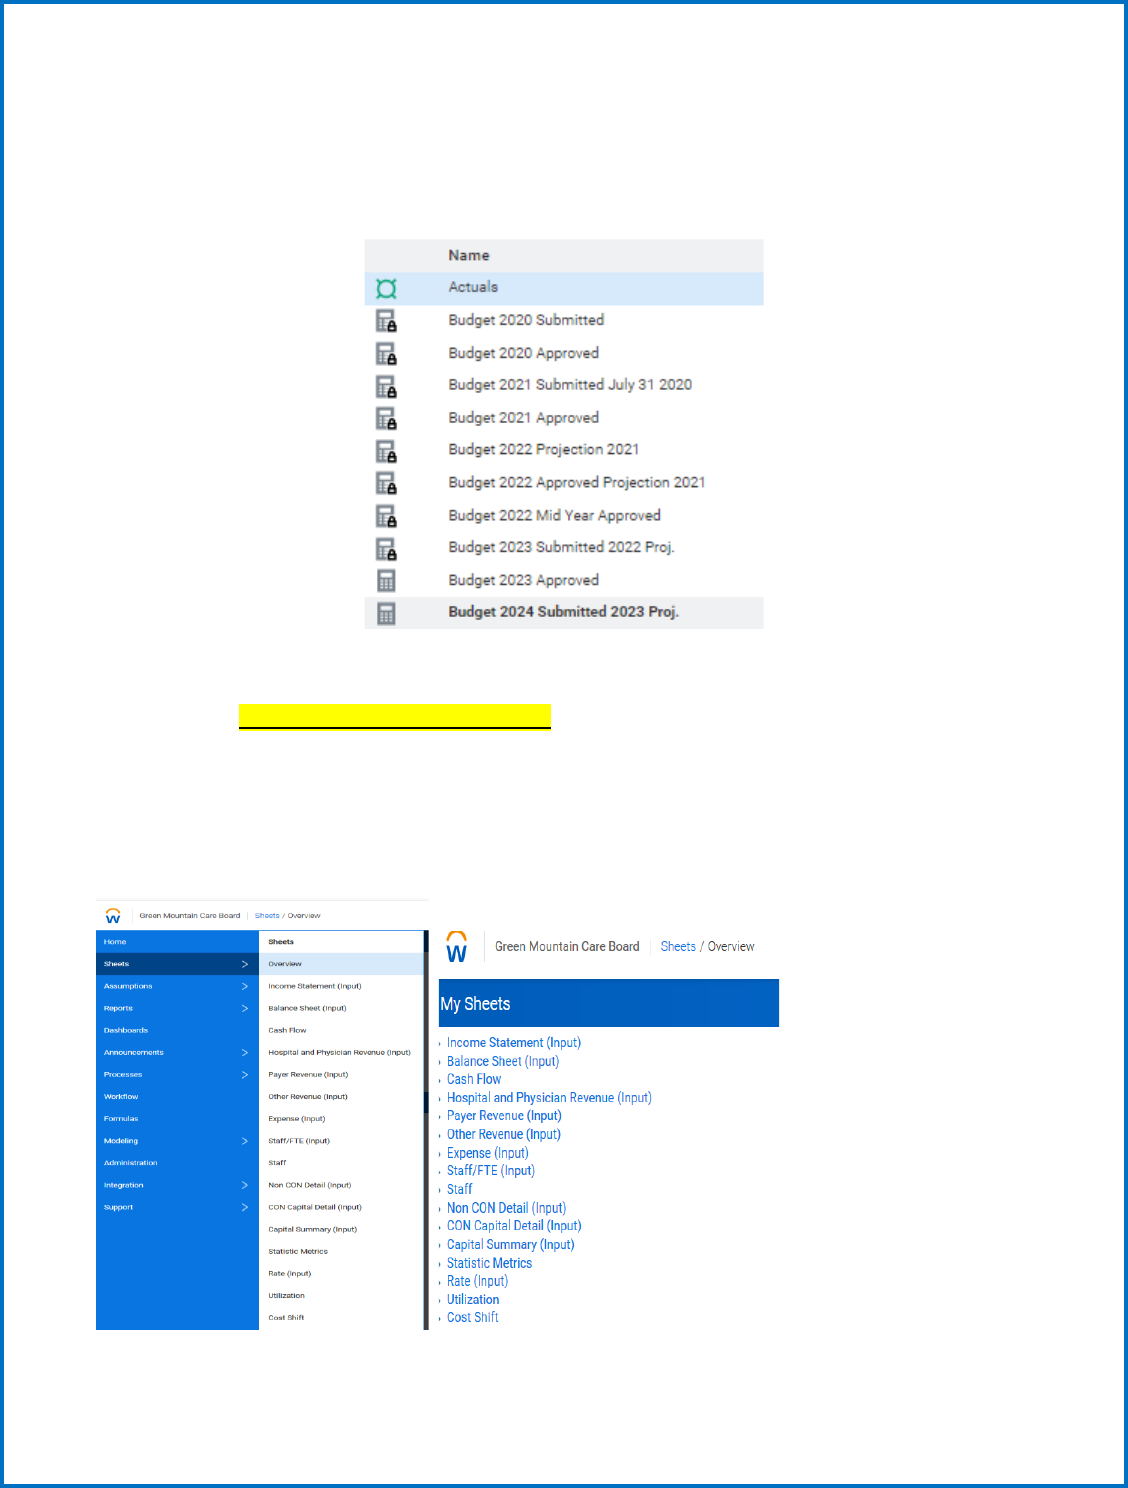
1. Versions
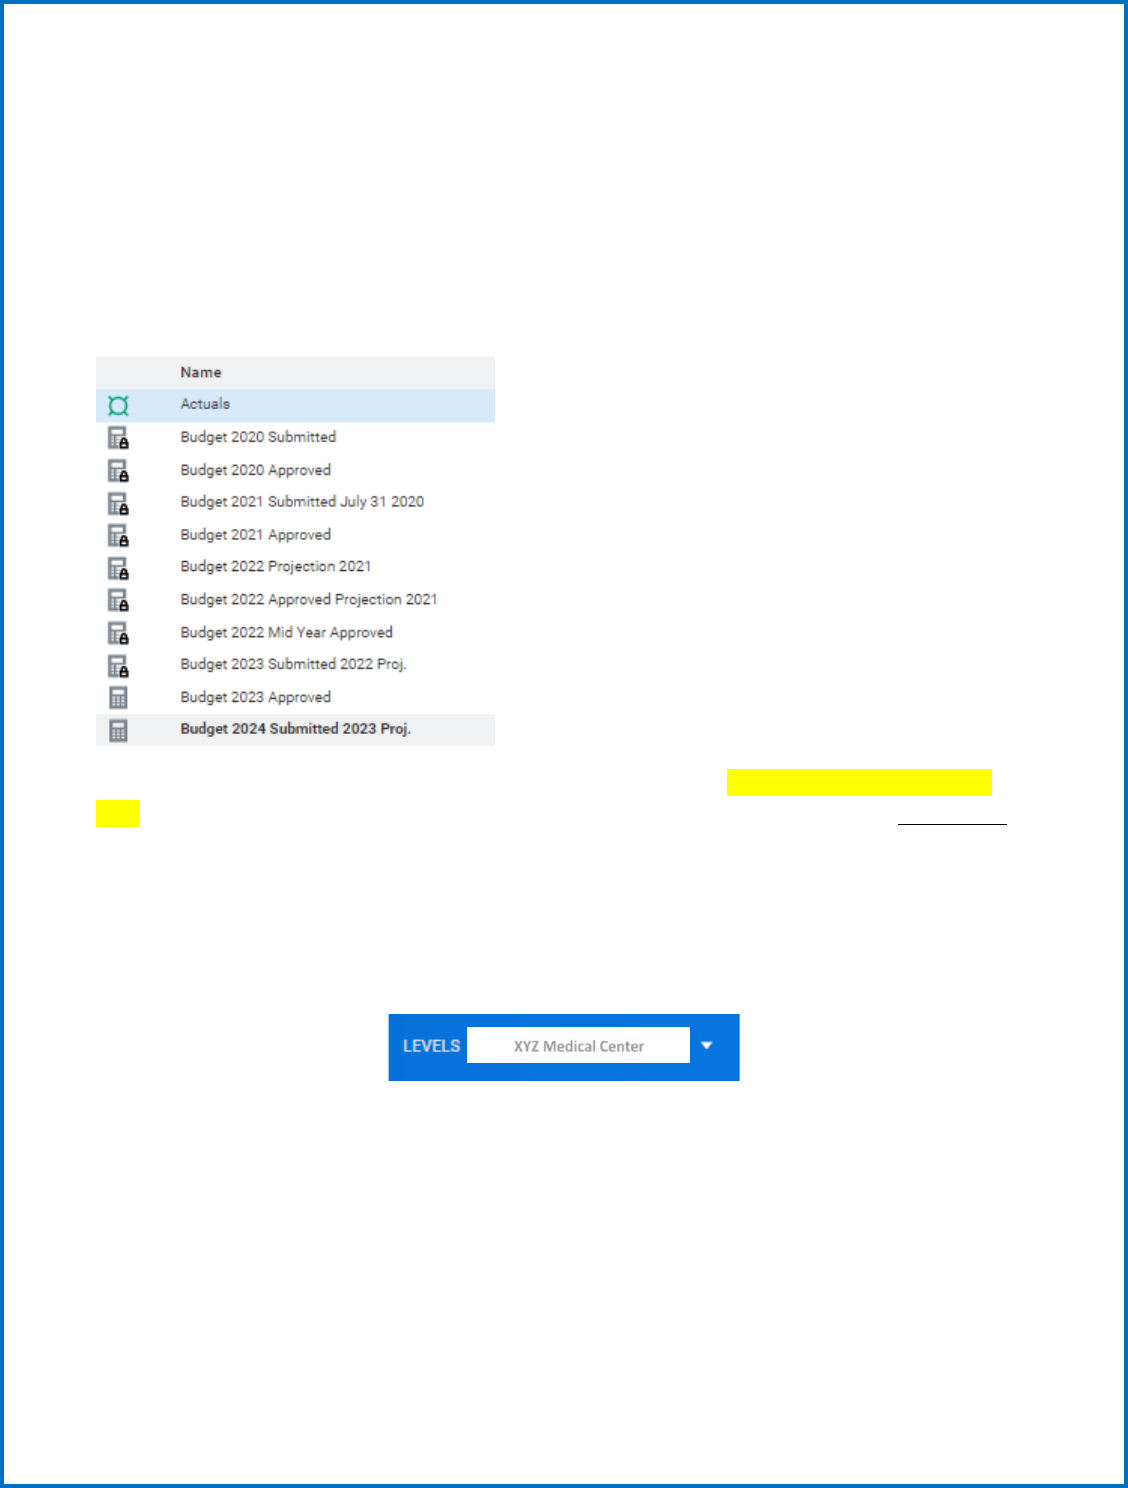
On the right side of the screen, you will notice two drop-down menus: One for Version and one for
Level. The Versions in Workday Adaptive Planning are synonymous with a file submission in the past.
7
The drop-down menu may show multiple versions (for prior submissions, etc.) However, only the
current version will allow for editing. This version will be the default option in the drop-down menu.
Additional Version Definitions: The Actuals version shows all historical actual data for 2001 – most
recent. Budget YYYY Mid-Year or Budget YYYY Approved is where the last approved budget is stored and
can be reviewed. The Historical Budgets version shows all historical approved budget data for 2001 –
2016. New versions will be created when working on Budgets and added to this drop-down.
Example Version drop-down menu:
The BOLDED default version is where you will input your budget data (Budget 2024 Submitted 2023
Proj.). The sheets include Actuals for the last few years, Prior Budget year which is to be overwritten
with your most recent projections and cells to input your current Budget data.
Levels
Currently you only have access to one hospital; it will appear as a static name in place of the drop down
as shown below:
2. Sheet Structure
The Workday Adaptive Planning budget tool maintains data monthly in the database. You will be
required to allocate monthly data when inputting. As a rule of thumb, you will be prompted if you need
to allocate the data monthly. How you do that is explained later in this document. Exceptions to that
requirement are also explained later in the document (beds, FTEs).
XYZ Medical Center

8
The detailed monthly data will be used by the GMCB staff for monthly budget analysis later in the
year. The hospital has the option of reporting seasonality or using the breakback rollup value option,
contact the GMCB staff for help.
When you are viewing a sheet, you will notice there are 2 colors of data in the cells. Green data
indicates “Actual” data (historical numbers), while Black data shows Budget or “Plan” data. The actuals
version will show all green numbers, the Historical Budgets version will show all black numbers, and
other Budget version will show green and black numbers as well. In most cases, accounts, departments,
and service areas have been alphabetized.
Note: Throughout the tool, you will see that amounts are not formatted for currency. Formatting will
occur as necessary at the reporting level.
When you want to input data onto a sheet in Adaptive, most of the time you will need to select your
hospital specific Level. After selecting a Level, you will notice some cells are white (monthly data), some
are blue, and some are grey. Any white or blue cell in Adaptive can be edited, while a grey cell cannot be
edited.
Some cells you will notice a small triangle in the bottom right corner. This indicates there is a formula in
place, pulling data from another section of the model. Most cells with formulas are locked (grayed out)
and cannot be edited. You will not see the formula mark if you are at a rollup level, however; you will
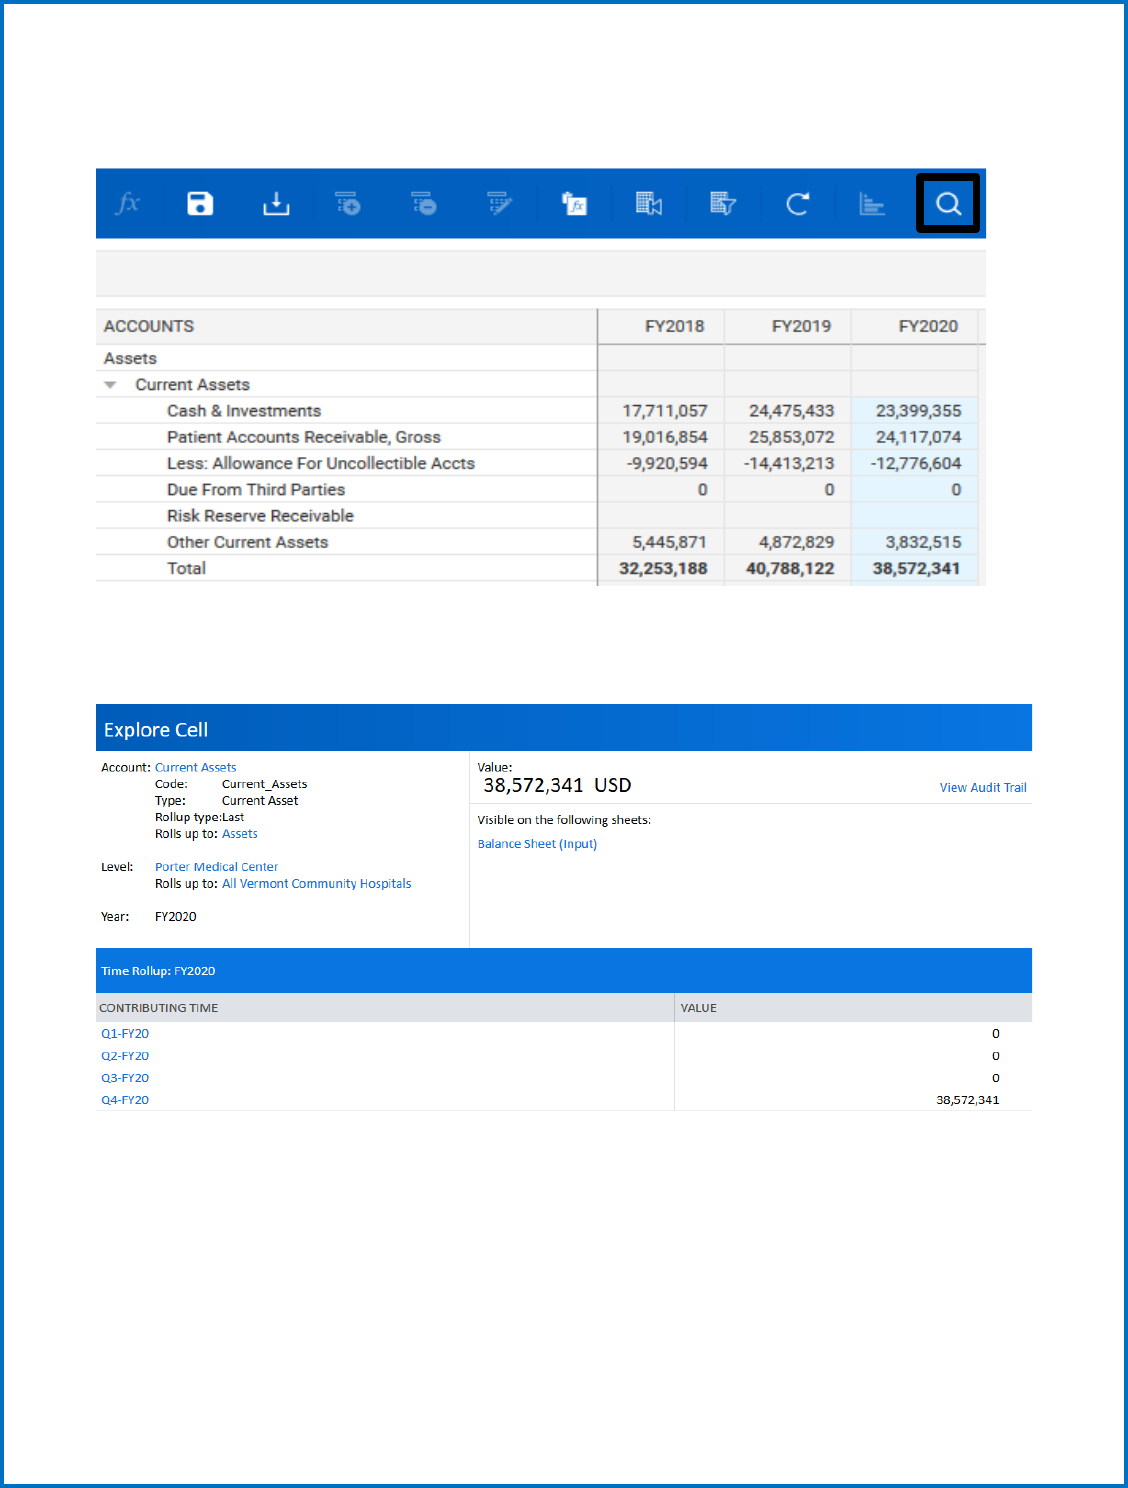
need to be at a lower level (month). You can drill into data at the rollup level though, by clicking the
magnifying glass to explore a cell. From there you can drill down to the lowest level to see where the
data is coming from.
9
To see where data is driven from on a sheet, you can select a cell and click the magnifying glass icon to
explore the cell:
If you are exploring a cell with a formula in it, you will see the formula in the pop-up window, and you
will have the ability to click on the specific formula links to drive down further into where the calculation
is coming from:
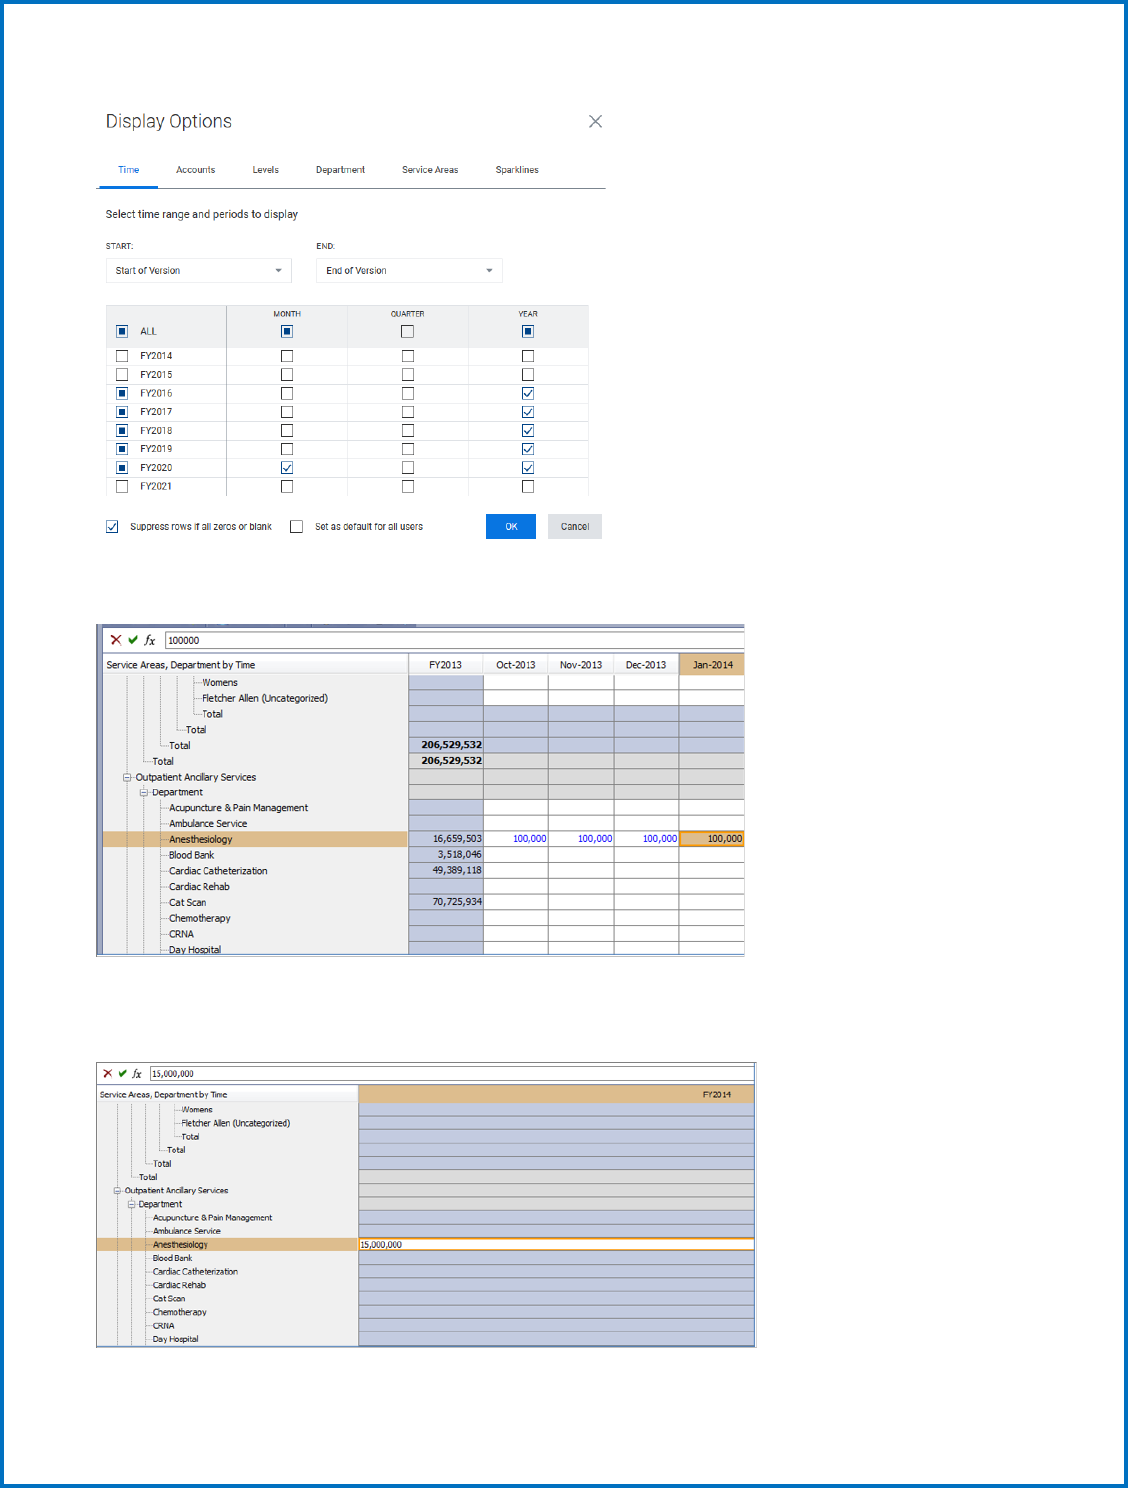
Depending on which Version and Level you are in, you will see data spanning from FY 2001 to FY 2026 or
FY2027. If you would like to change the view of the data, you can only show specific time periods by
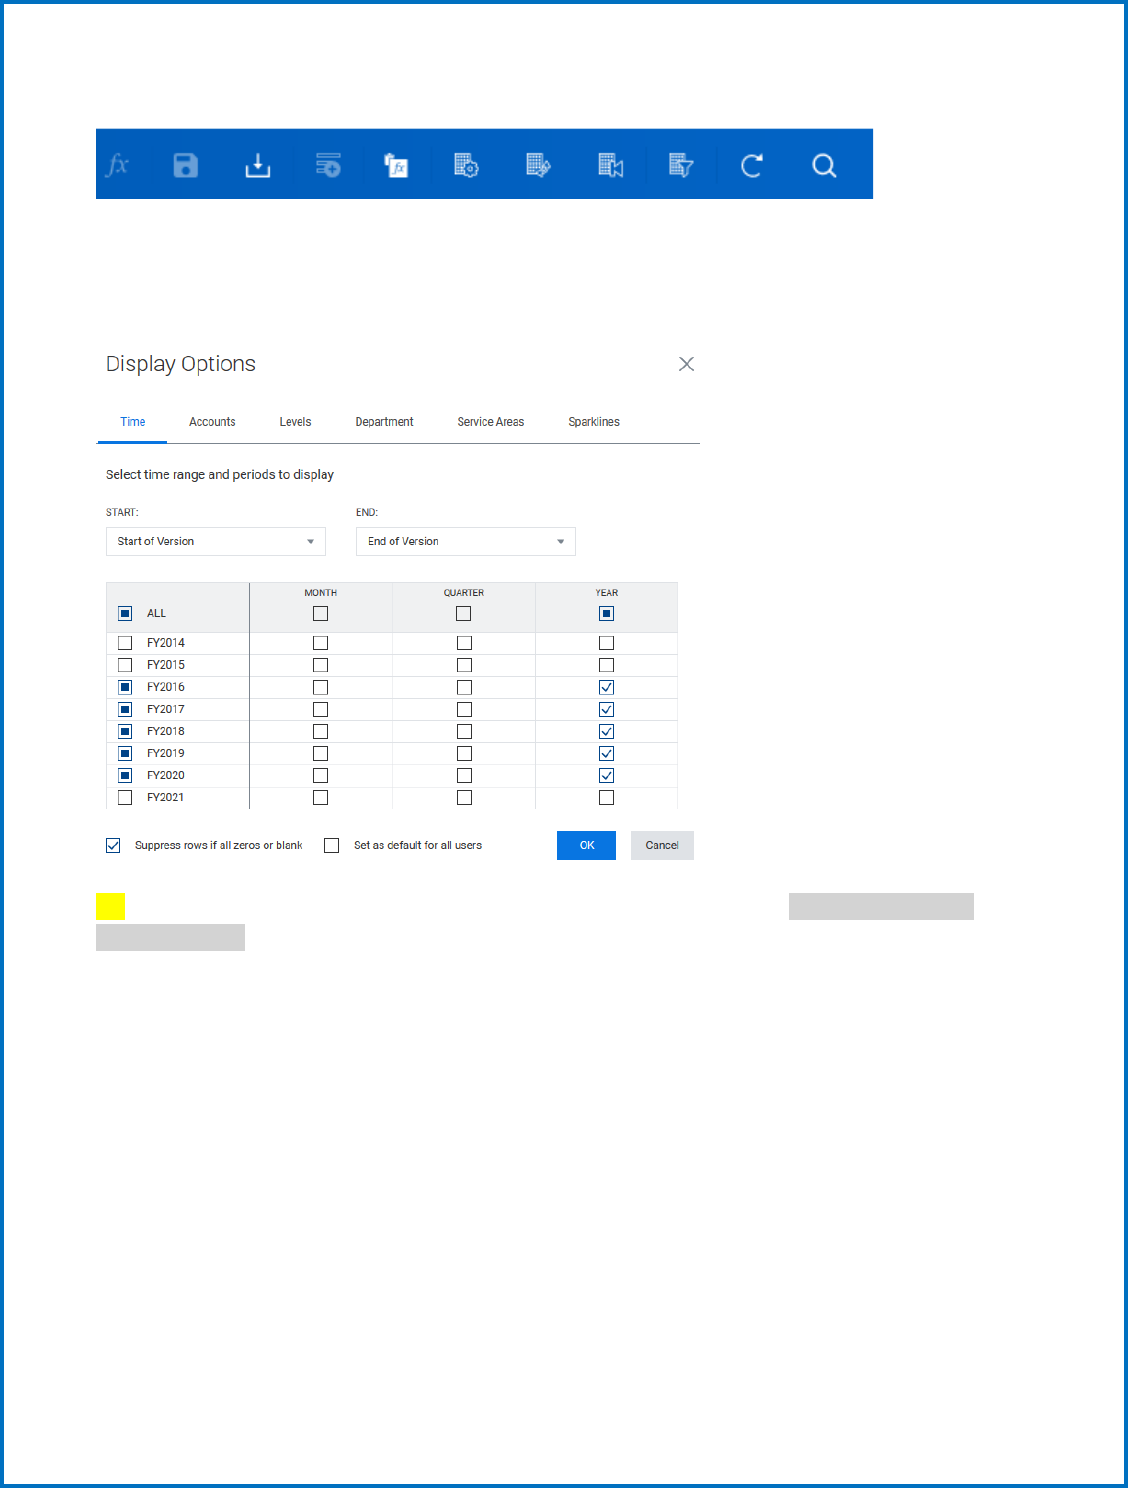
10
clicking the Display Options icon on the toolbar.
a. Standard Sheets
Check or uncheck the Months, Quarters, and Years you would like to see on the sheet. This function can
be used on all Standard Sheets.
TIP: If a sheet looks like it has several accounts without data, you can check “Suppress rows if all
zeroes or blank” to help eliminate unwanted rows. On the contrary, if you are having trouble finding
an account, look here first to see if this option is checked, and then uncheck it. Also, if you want to
select (or deselect) all the months/qtrs./years in a column, just click the box at the top of the
appropriate column.
To copy, cut, and paste you can now toggle between the two forms of copying, and use the following
keyboard shortcuts, for Windows (if you are using another platform, use its copy, cut, and paste
shortcuts):
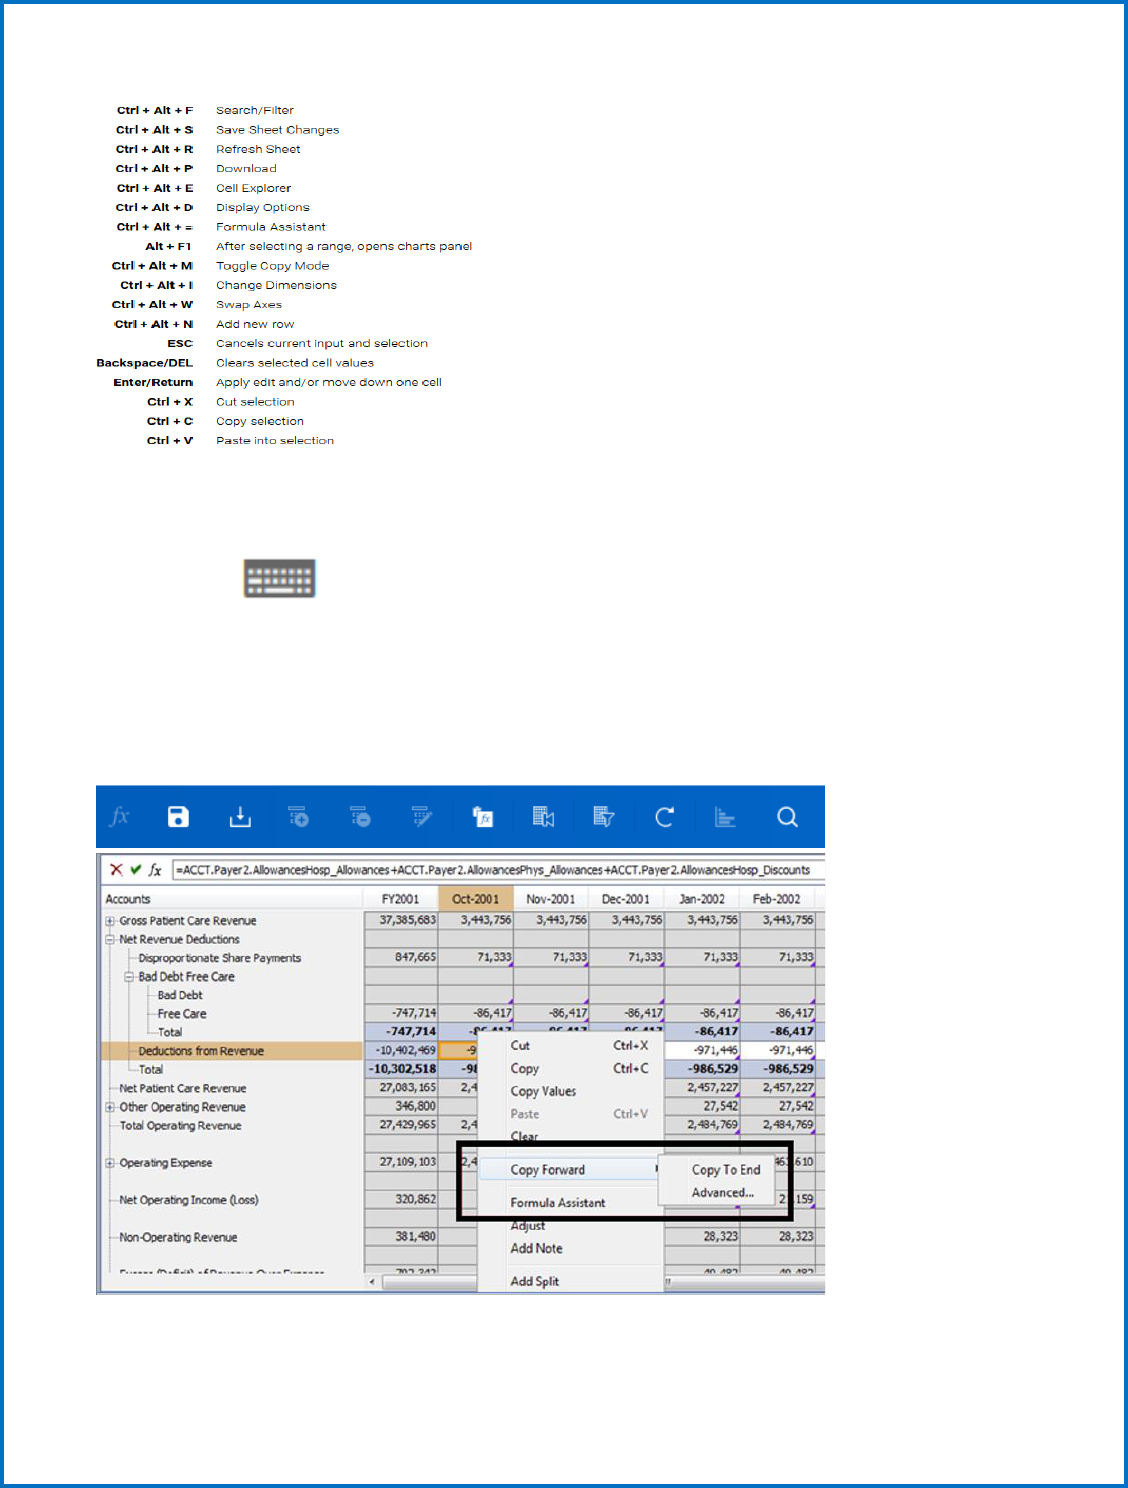
11
For a quick, in-app reminder of the keyboard shortcuts, click the keyboard legend icon in the lower right
corner of the screen.
Monthly data will be used by the GMCB staff for budget analysis later in the year.
You can manually input your monthly data or if you want to copy across the row, you can right click on
the cell with the data and select Copy Forward.
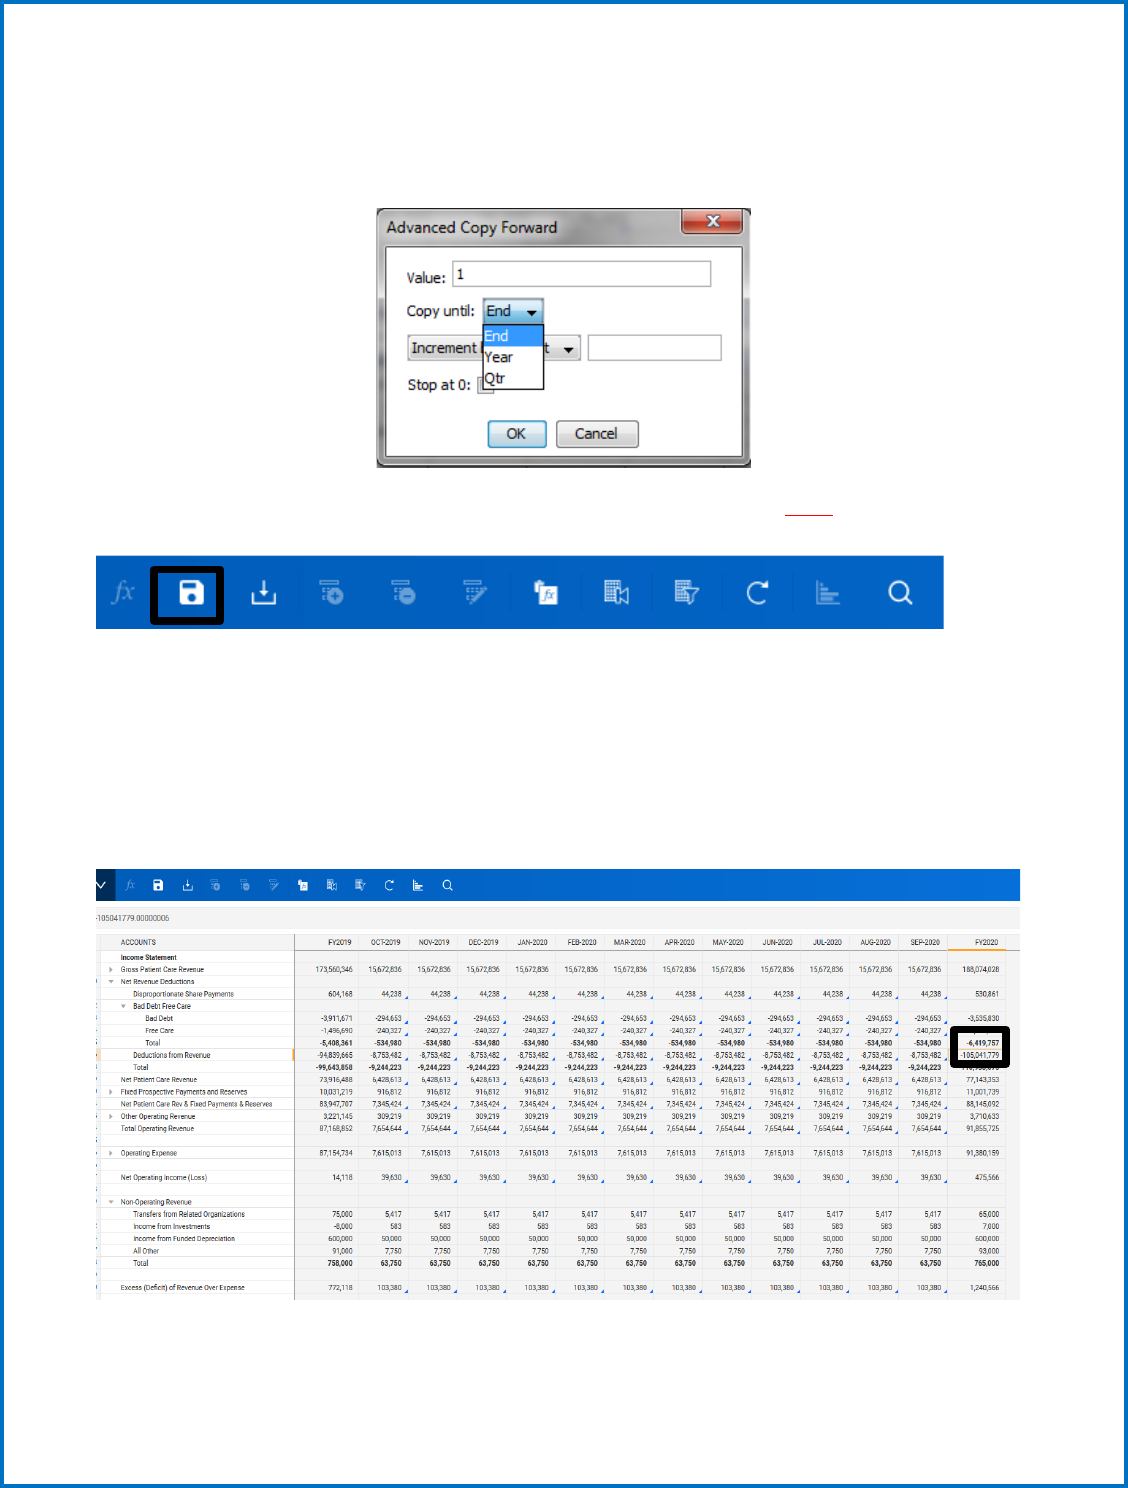
12
You can either Copy the Data to the End, which will bring the data across the row all the way to the end
of available years, or you can select Advanced to Copy the data until the end of the year or the end of
the Quarter. Just click the Copy until drop-down and select either Year or Quarter.
Whenever data is input onto a sheet, you will always need to remember to SAVE the changes on the
sheet. This can be done by clicking the disk icon in the toolbar:
There are other ways to spread data throughout cells on a sheet, such as breaking back a yearly amount
to its months or adjusting numbers to change proportionally or evenly.
If you have a yearly amount and want to break it back over the course of the year, you first need to
enter the total amount in the FY column.
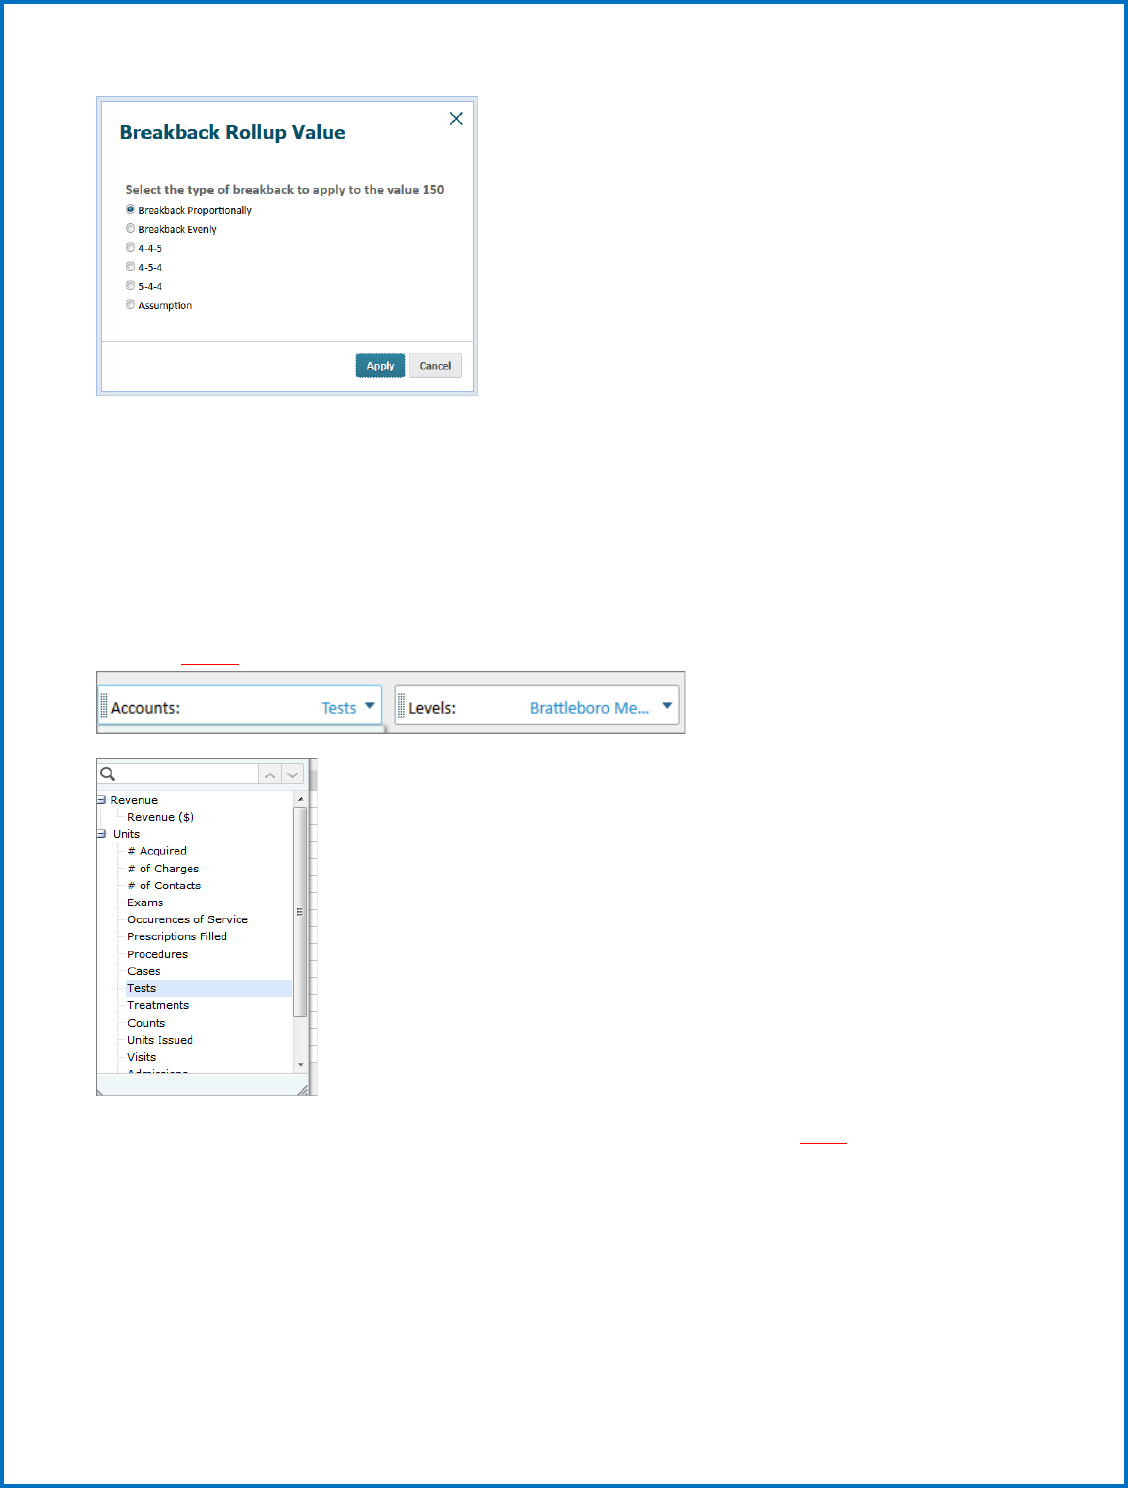
When you hit enter, a pop-up window will appear with several options:
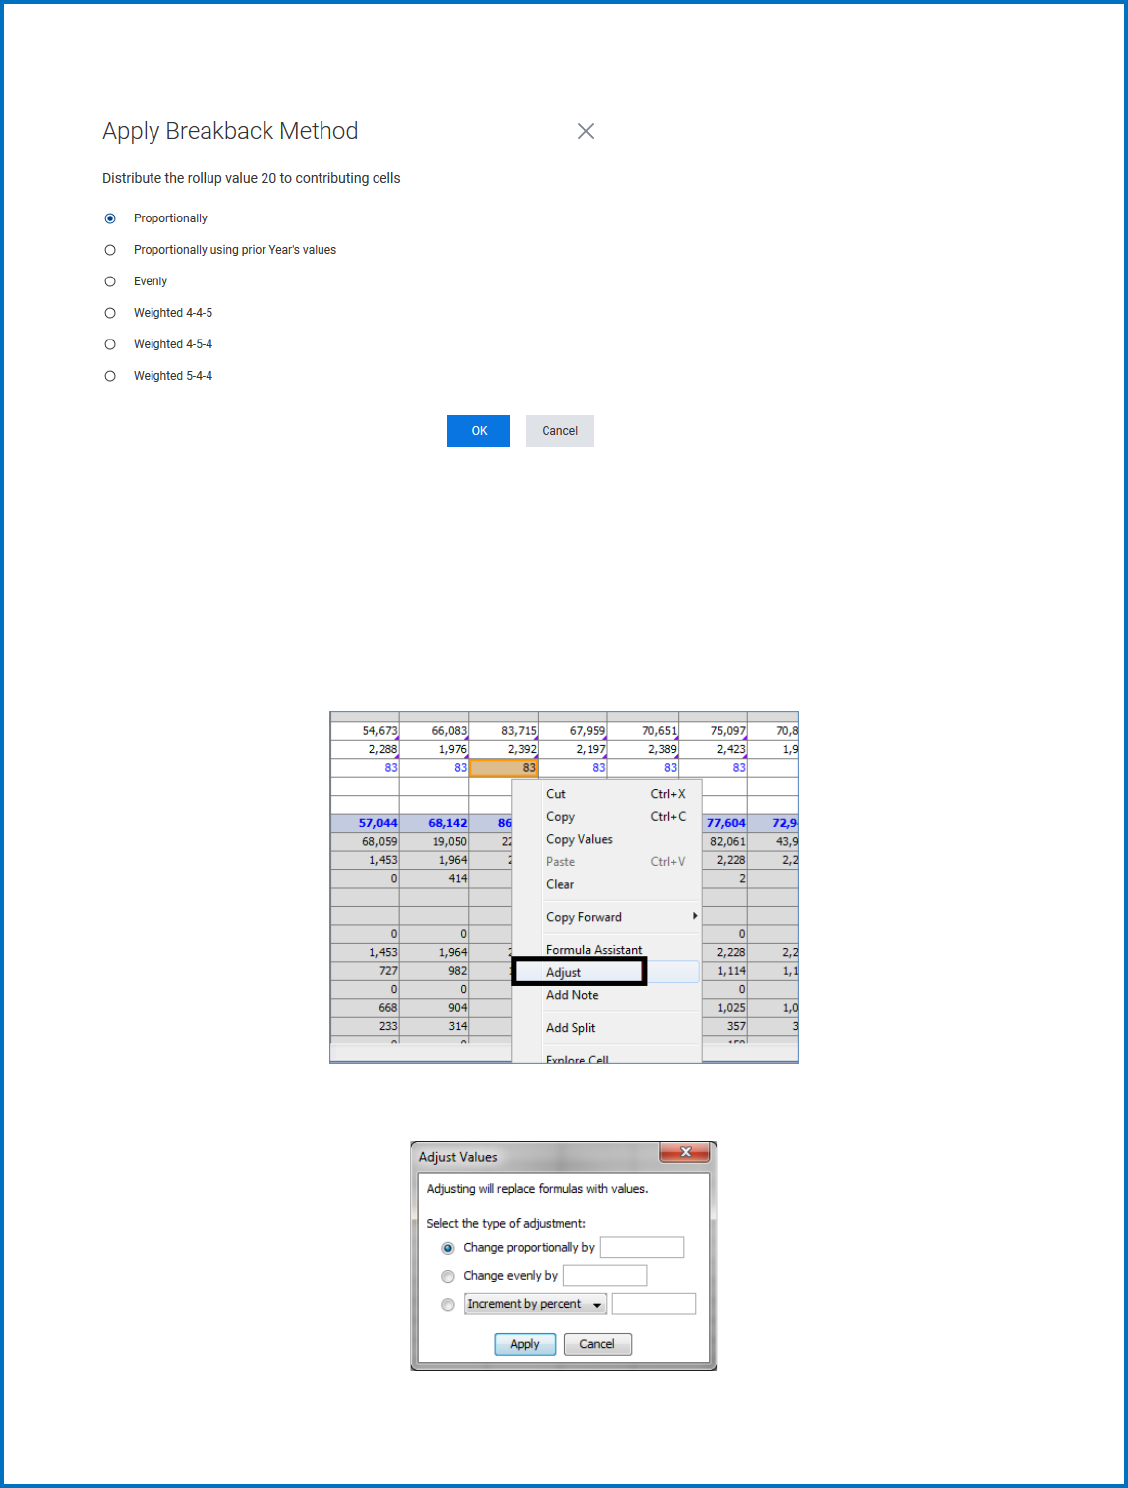
13
Breaking back proportionally will break back the number you entered based on numbers already
entered in the months. Breaking back proportionally using prior year will break back the number you
entered based on numbers entered in the months for the prior year. Break back evenly populates
numbers evenly across all months. If you base your numbers on a weekly schedule, you can choose from
4-4-5, 4-5-4 or 5-4-4.
You can adjust a number by right clicking on it and selecting “adjust”.
This brings up the pop-up window:
14
Here you can enter amounts to change the number proportionally, evenly, or increase by a percent. You
can choose multiple cells to make them all change by the options you select.
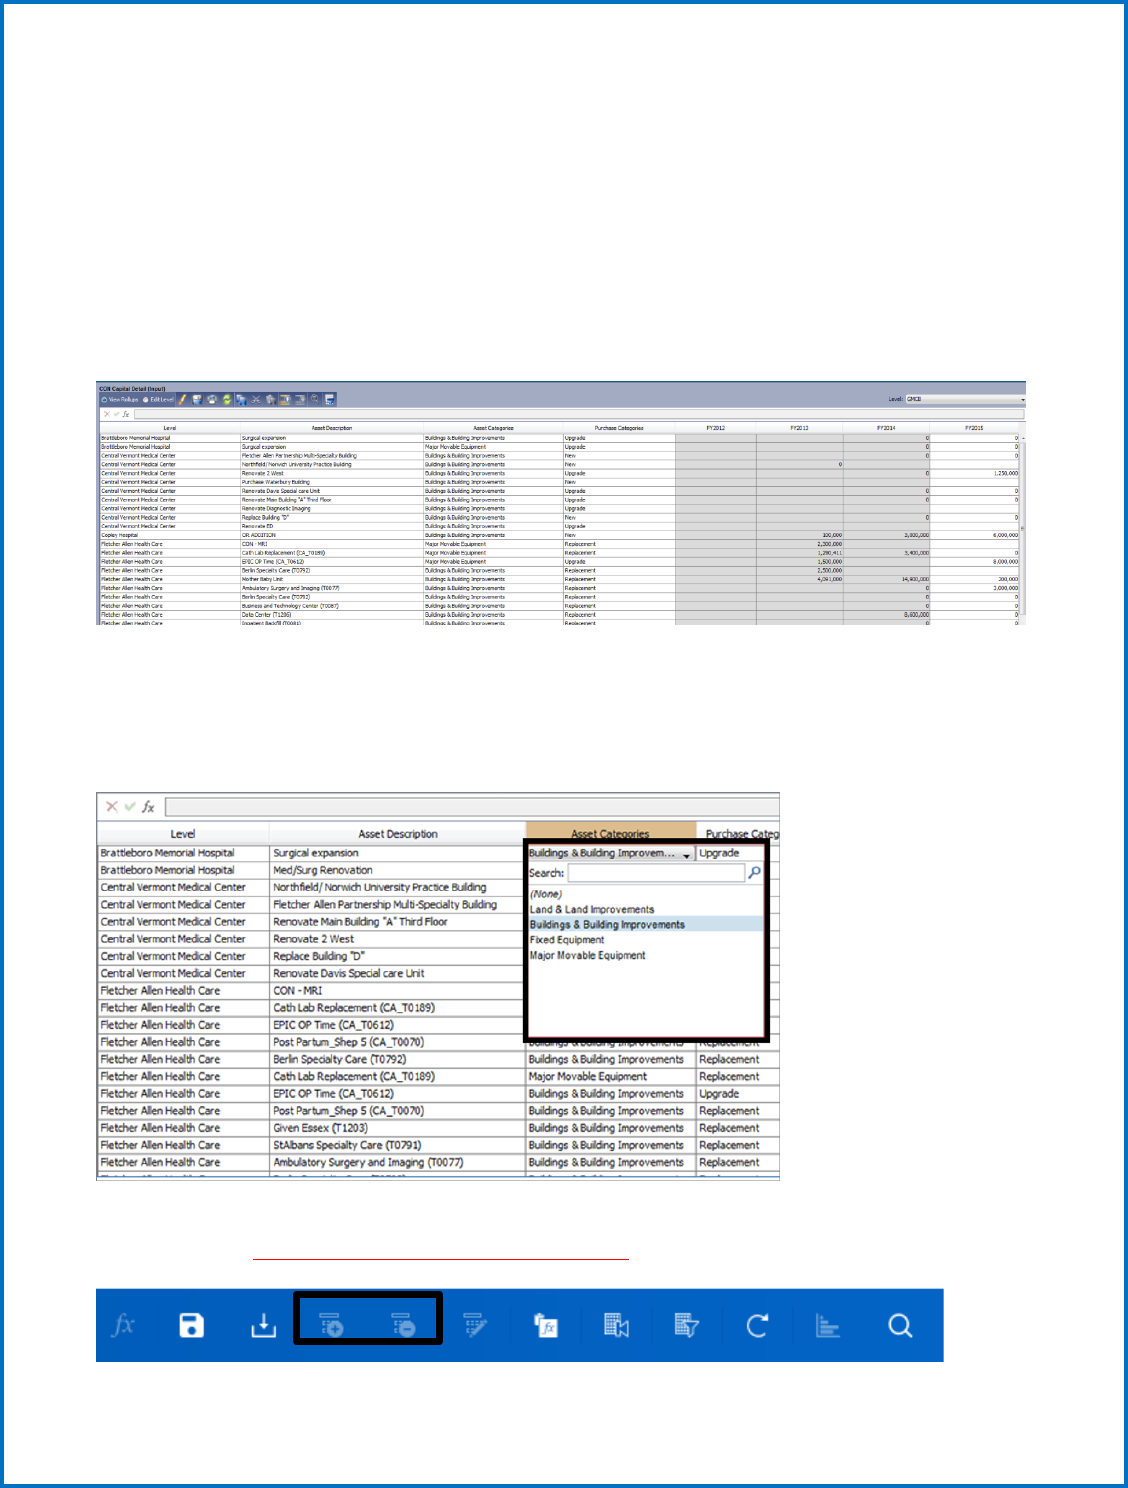
b. Modeled Sheets
While Standard sheets are the most basic type of sheet in Adaptive, there are two other types of sheets
you will work with. Modeled sheets show a list of columns where data will need to be input. An example
is the CON Capital Detail sheet shown below, where data will be entered under each column. This sheet
provides the ability for different hospitals to input different data/information that is unique to their
circumstances.
Like standard sheets, only white cells can be edited, while grey cells (if any) show numbers being
calculated depending on the input data. Each column will have a different option for entering data;
some are drop down menus with a list of choices, some are dates that you choose from a calendar,
and some are free text where you enter the specific data yourself.
To add a new row on a modeled sheet, click the Plus (+) button on the toolbar. To delete a row, click the
Minus (-) button. Use this option ONLY for the CON sheets.
15
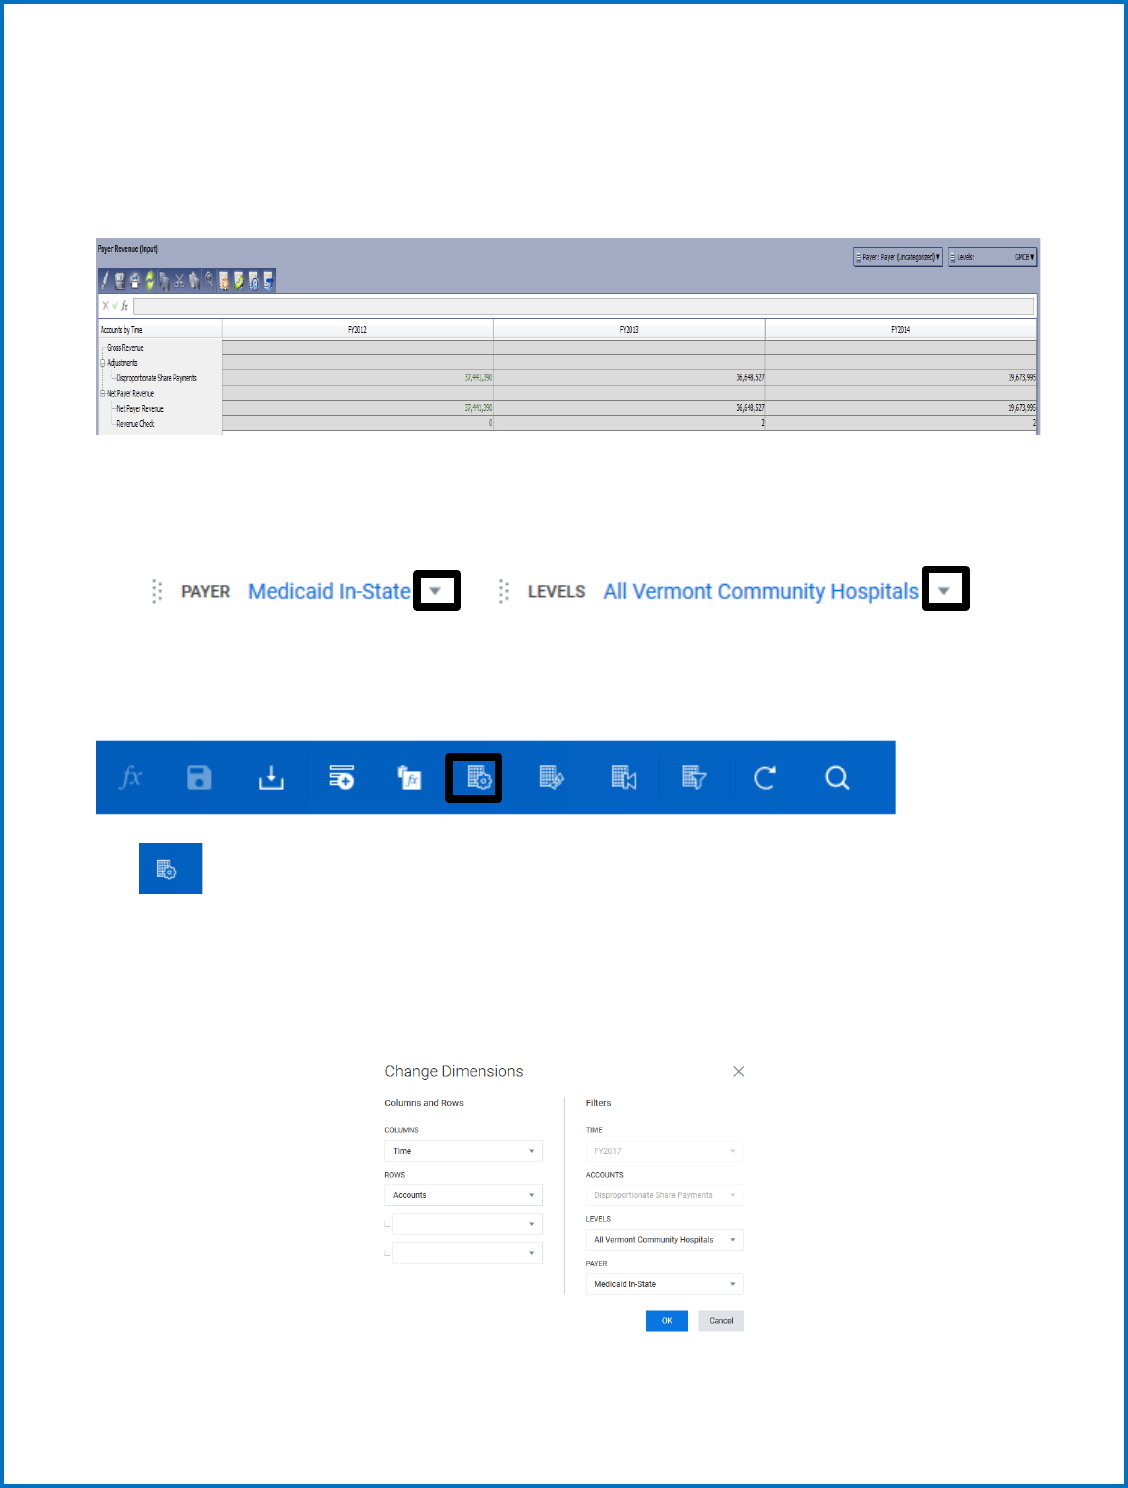
c. Cube Sheets
The third kind of sheet you encounter in the model is a Cube sheet. These sheets are like standard
sheets in the way they portray data, except they can be viewed for a variety of dimensions available in a
series of drop-down menus on the sheet.
The screenshot above shows the Payer Revenue sheet, where you notice 2 different drop-down menus
in the upper left corner of the screen below the icons.
Depending on how you want to view the data on the sheet, you can select different options from the
drop-down menus. You can also change the view of the sheet by different buttons on the toolbar.
The icon lets you change the overall view of what you see on the sheet, such as dimensions you
want on the Horizontal and Vertical axis. You can “Nest” accounts by selecting different dimensions in a
specific order on the vertical axis. In the example above, the vertical axis is nested by Accounts, and
underneath each Level are the Payer categories. You can add more dimensions to be nested under that
or rearrange the order of account nesting from this window.
16
1. Entering the Budget or Actuals
(step by step instructions)
Navigate to the Budget 2024 Submitted 2023 Proj. version. You will not have access to change any other
years in the Budget version. If you believe the Budget 2023 Approved is incorrect or any other prior
years’ information, contact the GMCB staff.
Once you have confirmed you are on the current version, you can then navigate to Sheets for all budget
data entry. Use either way to access your sheets.

17
There are ten sheets requiring data entry, each sheet that requires input is denoted by (Input) being
included in the sheet title. These sheets requiring input are summarized below:
Income Statement Staff/FTE
Balance Sheet Non-CON detail
Hospital and Physician Revenue (Utilization) CON detail
Payer Revenue Capital Summary
Other Revenue Rate
Expense (do not use)
18
The following section will now walk you through the recommended steps and sheet configurations to
complete your budget.
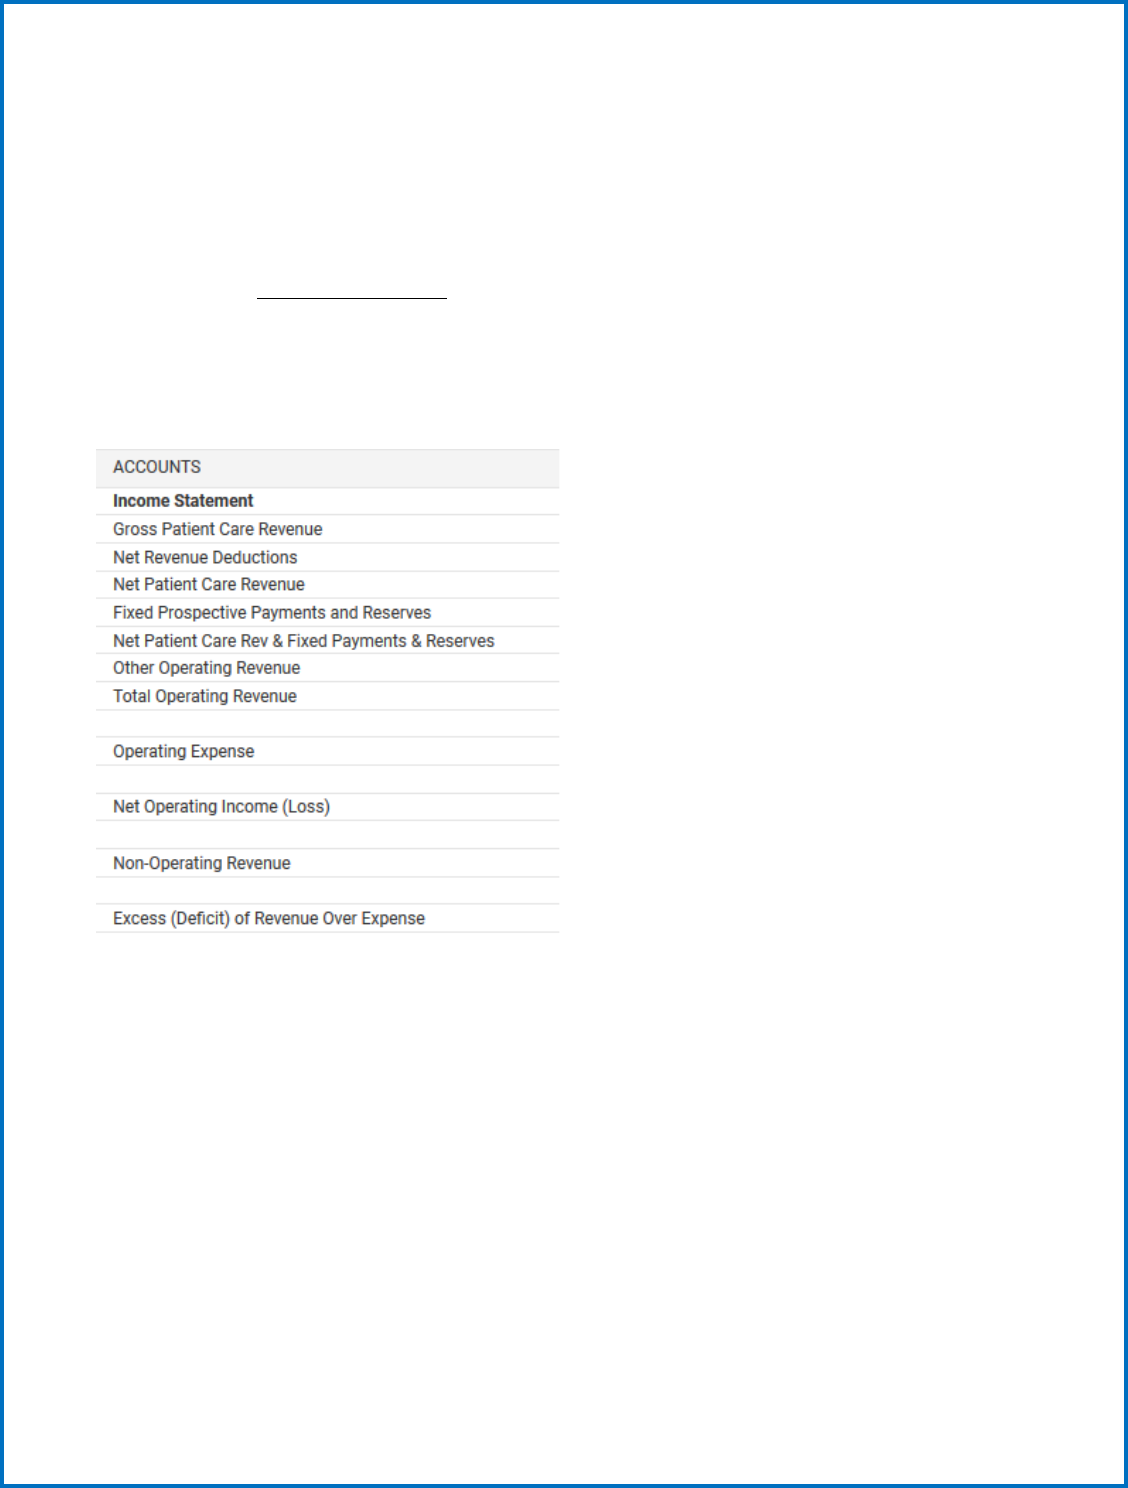
1) Income Statement Sheet (Input) Sheet
The Income Statement now contains static data for all versions. There are no formulas or linked
accounts from other sheets, so all data is set on this sheet and not pulling from anywhere else in the
model except the Other Revenue sheet. The Income Statement sheet shows all GL Accounts, including
actual data and plan data. Accounts previously reported in “Other” line items: ACO Dues, Other
Purchased Services Consulting, Other Purchased Services Travelers, Other Purchased Services Misc.,
Pharmaceuticals and Utilities. Some accounts were previously reporting within the Expense Sheet and
Other Operating Revenue - COVID-19 Stimulus and Other Grant Funding.
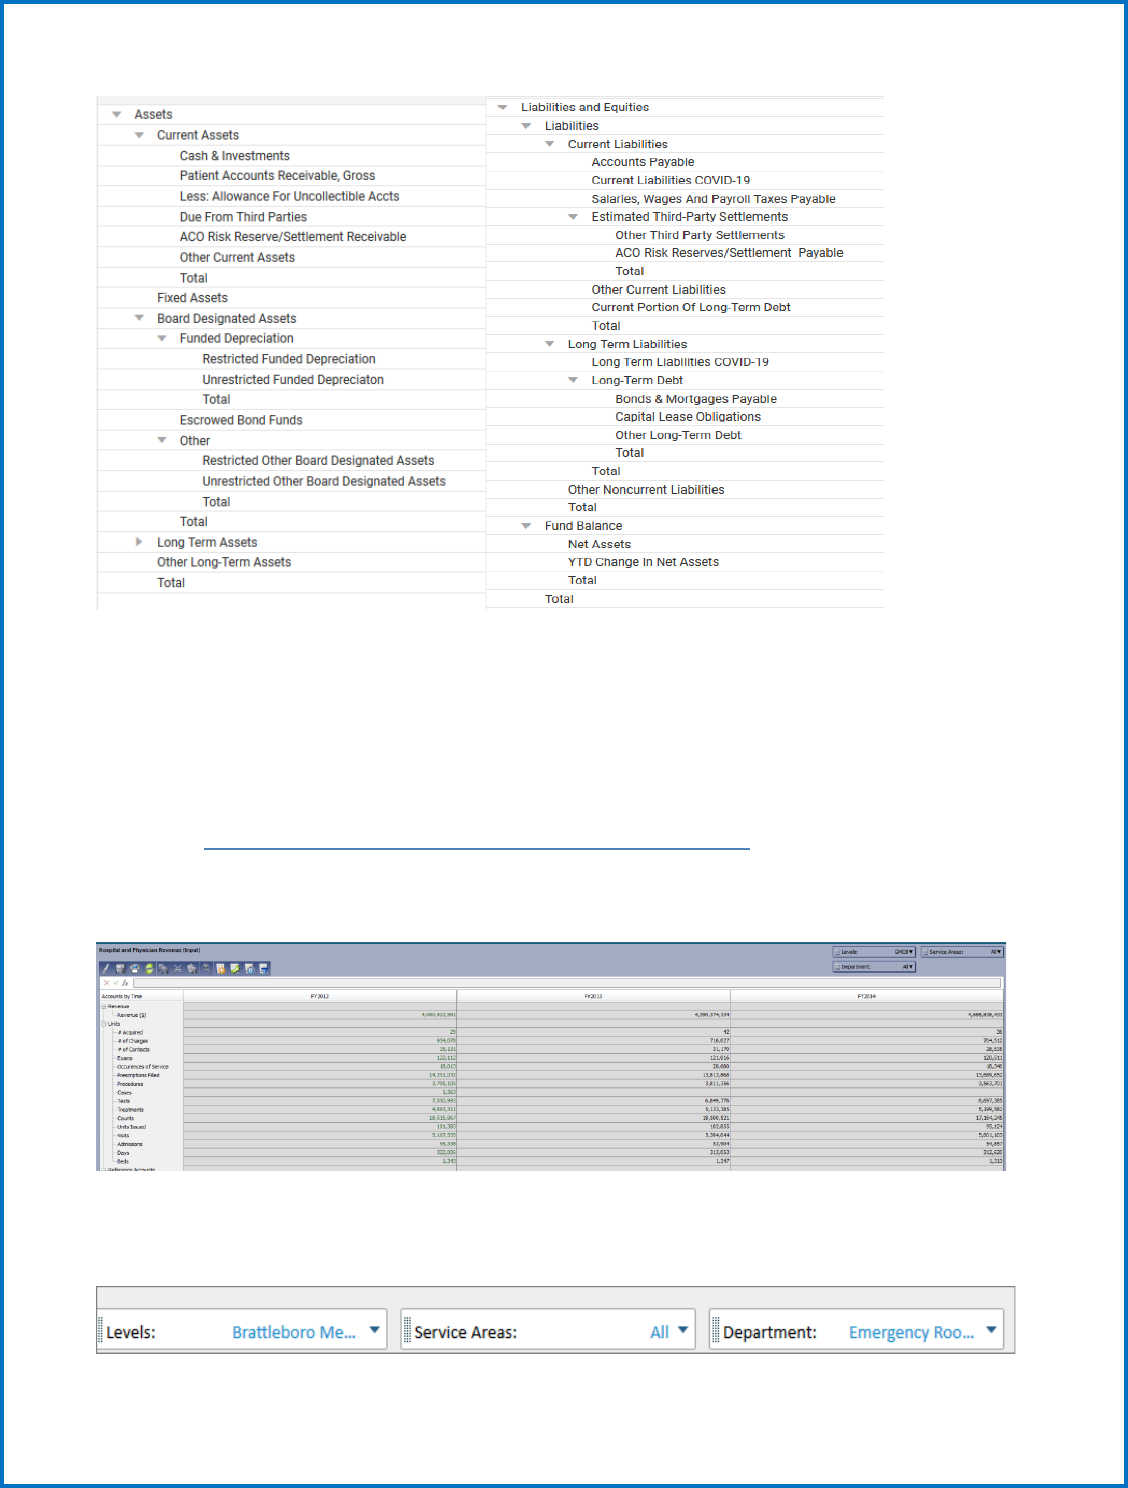
2) Balance Sheet (Input) Sheet
The Balance Sheet only contains static data for all versions. There are no formulas on this sheet,
so all data is set on this sheet and not pulling from anywhere else in the model. There is a check
at the bottom of the sheet which should show 0 if everything balances. Note accounts: Current
Assets – ACO Risk Reserve/Settlement Receivable, Restricted Funded Depreciation,
Unrestricted Funded Depreciation, Restricted Other Board Designated Assets,
Unrestricted Other Board Designated Assets, Current Liabilities - COVID-19, Current
Liabilities – ACO Risk Reserve/Settlement Payable, and Long-Term Liabilities - COVID-19.
19
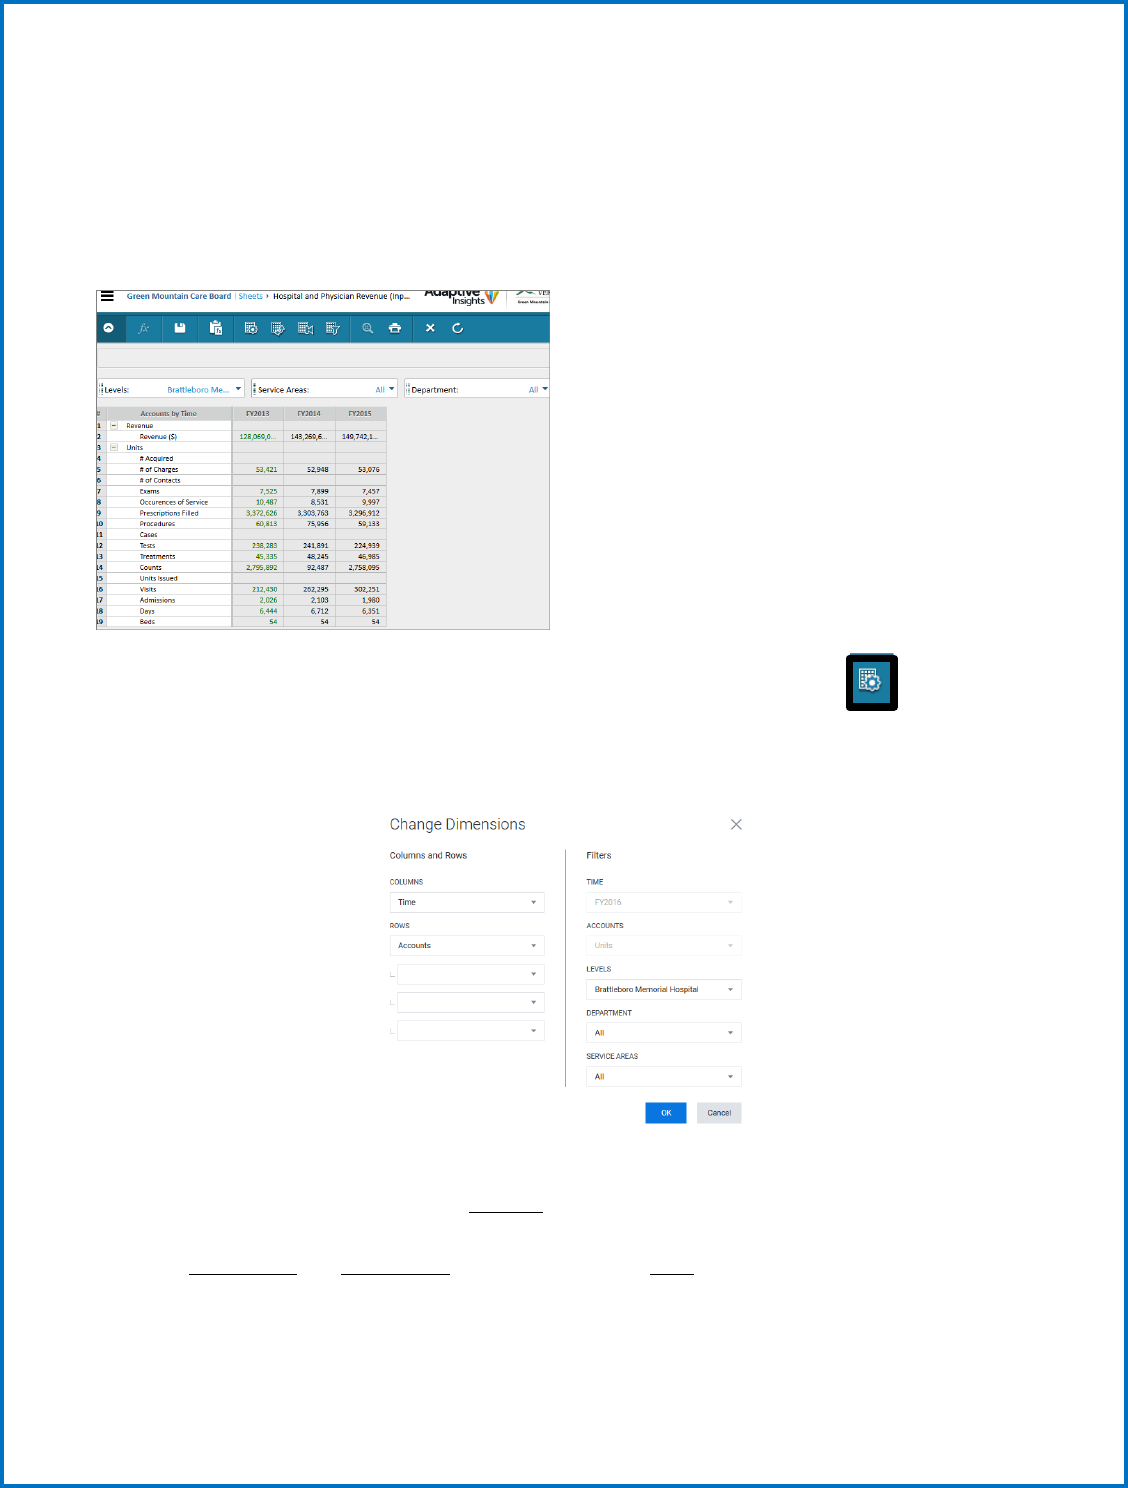
3) Revenue and Utilization Steps
First, Navigate to Sheets > Hospital and Physician Revenue (cube sheet).
Hospital and Physician Revenue (Input) Sheet no longer linked to the
Income Statement
This sheet contains all Gross Patient Care Revenue, and utilization statistics.
There are many ways to view this sheet since there are several different dimension choices: Levels,
Accounts, Service Areas, and Departments. You will see a list of dimensions to the top left, but will show
differently depending on how you choose to view the sheet:
Enter all hospital utilization (units) in
hospital and physician revenue sheet. You
are not required to input revenues.
20
Note: Departments and other dimensions are sorted alphabetically not necessarily in the same order as
you have seen them grouped in the past.
The current view has accounts on the vertical and time across the horizontal. This leaves Levels (which
hospital), Services Areas (IP & OP ancillary, SNF, Swing, etc.) and Department (revenue/cost centers) to
choose from their drop-down menus.
You can change what you see on each axis, and even nest your choices by using the Change
Dimensions icon. An example of a different way to look at this sheet would be to nest Departments
under Service Areas:
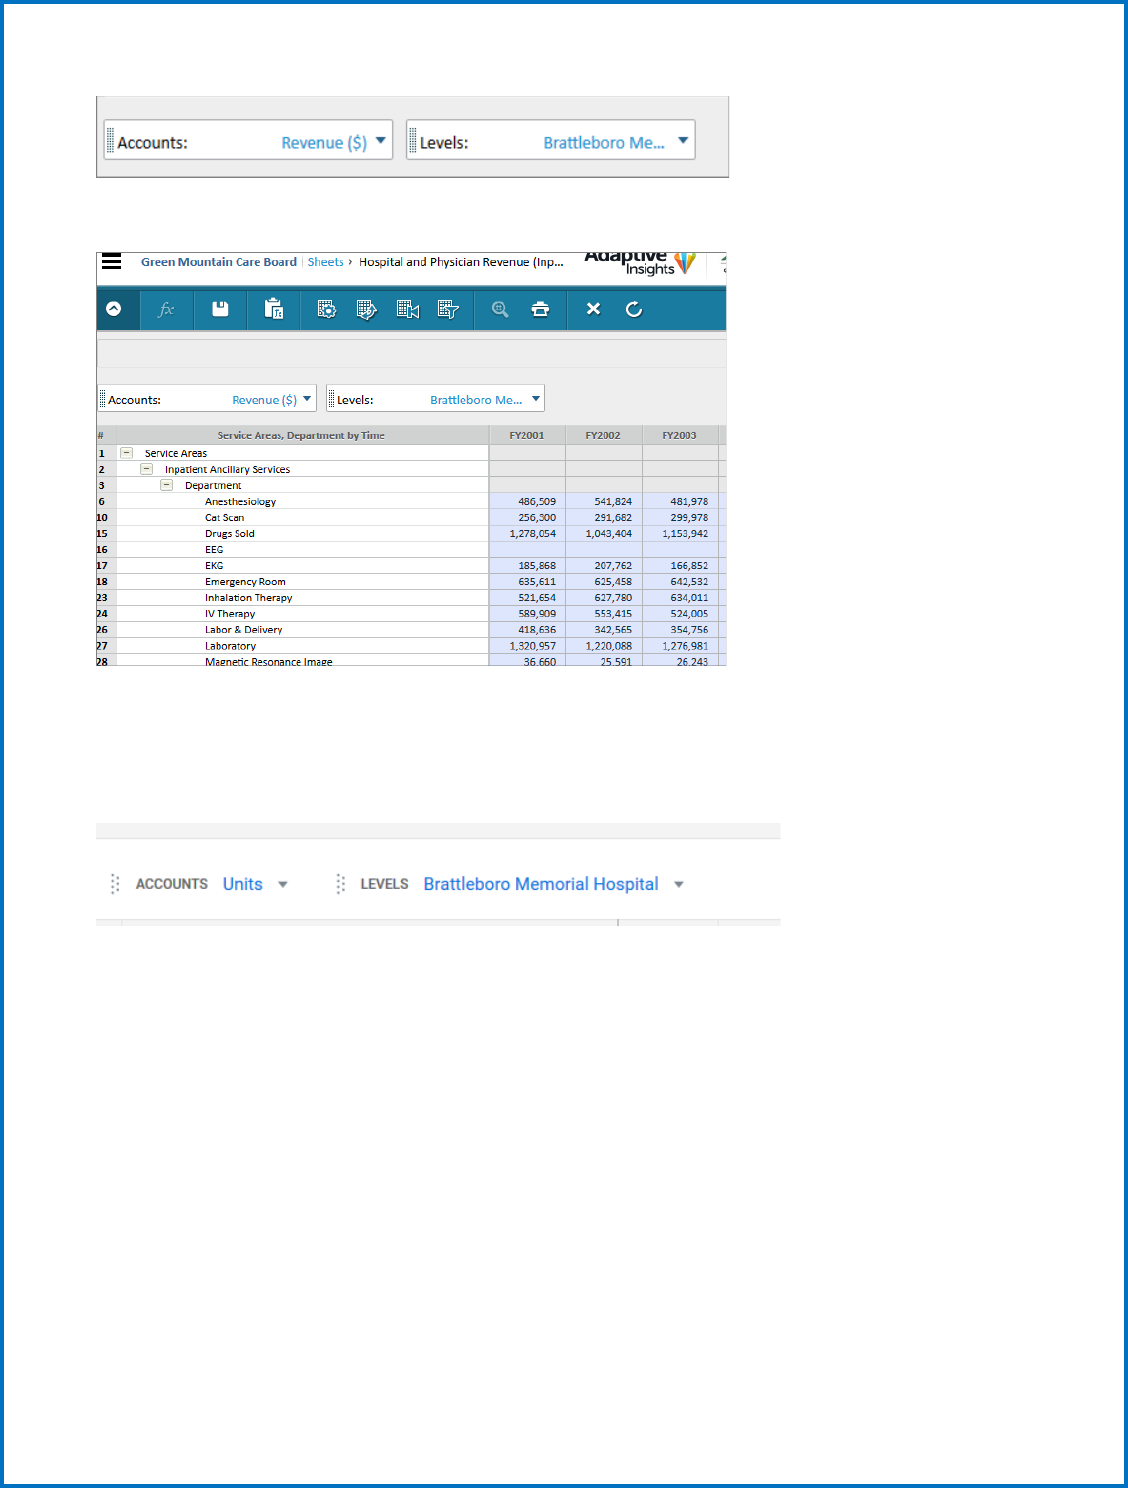
This would give you a view of each Service Area and Each Department that belongs under specific
Service Areas. You can also choose which Account you want to view from the drop-down menu for your
Hospital. The example below shows Historical Budget Revenue for Brattleboro Memorial Hospital,
nested by Service area and Department on the vertical across Time on the horizontal. You can also
expand (+) and contract (-) Service Areas and Departments to see more Summary/Detailed views.
21
You can experiment with dimension changes to get the view that you want on this sheet.
When entering data onto the sheet, you can do it by monthly amounts or by annual amounts. Detailed
monthly data will be used by the GMCB for budget analysis later in the year.
When entering data, make sure you have selected a Hospital and the Account you are entering.
When entering monthly data, make sure months are chosen for the proper year.
22
You can scroll up and down the Service areas and departments and enter data where it is needed.
If entering annual amounts, enter the yearly total in the FY YYYY column, and after you hit enter, choose
the option that you want to see the total broken back by monthly (breakback evenly).
23
a. Input--Inpatient and Outpatient Statistic /Utilization information
Once you have completed entering Revenue you need to enter statistical/unit information for each
department. To do this, you remain on the Hospital and Physician Revenue tab and there are two
options for how to enter this information. The first one would be to leave the view unchanged and
simply use the drop-down list that was showing revenue and select a statistic/unit. The system will only
let you enter statistics/units into departments that make sense (i.e., beds will only be available for
departments with beds). Once you pick this statistic, simply update all the appropriate departments,
and then SAVE, and move on to the next statistic. See the screen shot below for how this would work.
Once you have populated all the appropriate statistics on this sheet be sure to SAVE all changes and
then move on to the next step. Note: When entering bed data, just input the total number – there is
no need to “breakback” the data into monthly amounts.
24
4) Payer Revenue (Input) Sheet - no longer linked to the Income Statement
Payer is another cube sheet with several dimensions: Levels, Accounts and Payer Type. The Payer Types
include Commercial (broken up by Commercial, Commercial-FPP, Self-Pay, Other and Workers Comp),
Medicaid (Broken up by In-State, In-State-FPP and Out-of-State), Medicare, Medicare-FPP and
Unallocated. The Account groups include Hospital, Physician, Contractual Allowances, and
Disproportionate Share Payments. This sheet can have its dimensions changed to customize a view to
your liking.
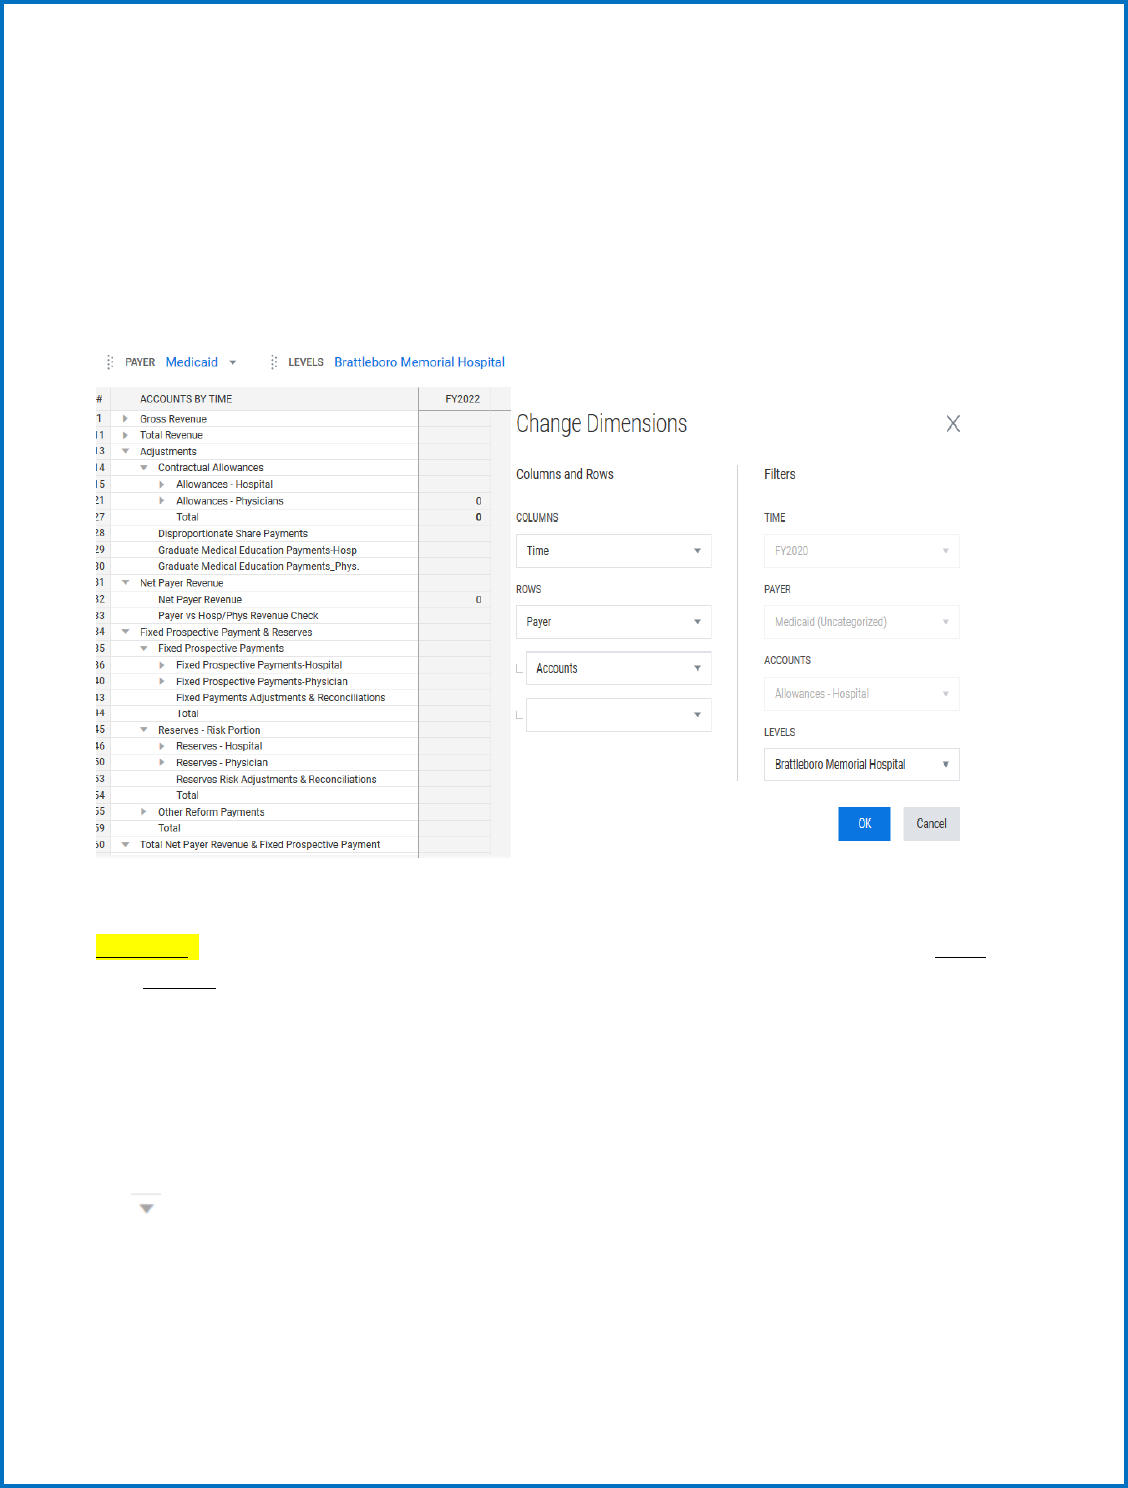
Useful Tip: Use the change dimension icon (wheel) to re-sort your vertical dimensions first by Payer and
then Account (shown below) to get the best view for imputing data.
This will allow you to enter all data related to Payer revenue and allowances. You will want to change
your view using the change dimension icon to look like the view below:
You will then navigate down the list of Payers populating the appropriate fields for gross revenue,
contractual allowances and bad debt as needed. If an account is not applicable to a specific payer,
simply leave it blank. Also, note that once you have filled out one section, you can collapse it by clicking
the button next to the Payer type.
25
Note: If you intend to use the Uncategorized account, contact the GMCB for assistance first.
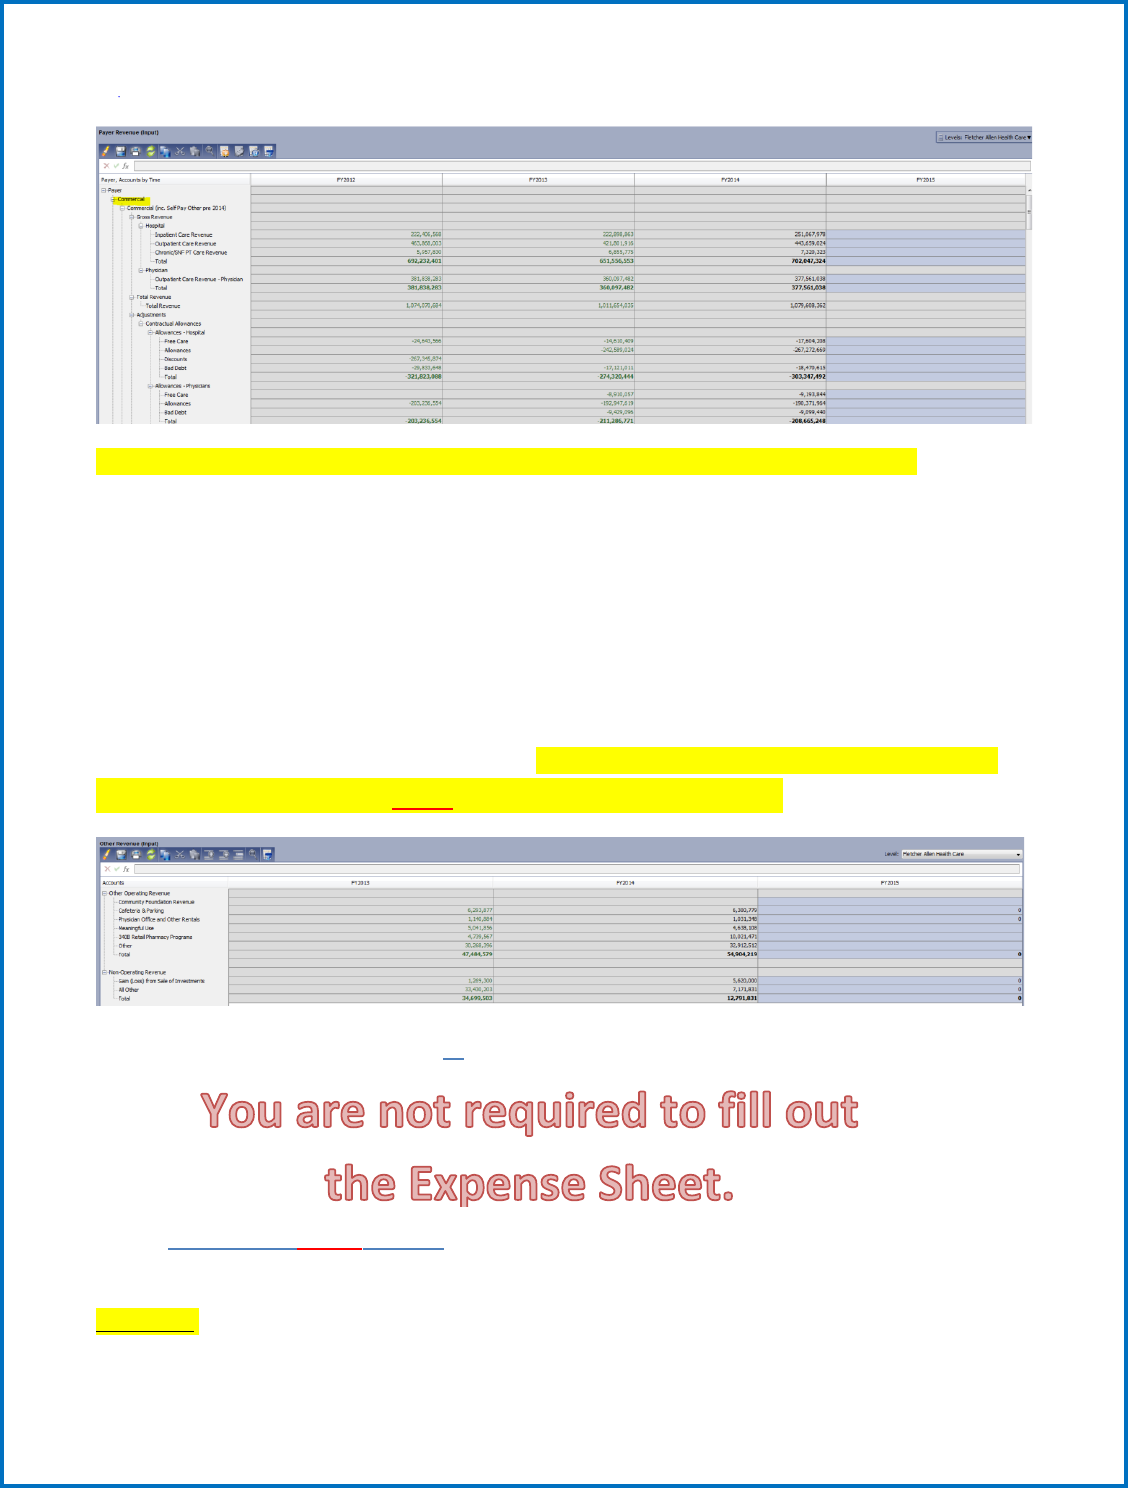
5) Other Revenue (Input) Sheet
Other Revenue is a standard sheet displaying all other accounts related to Other operating revenue and
Non-operating revenue. There are no additional dimensions on this sheet; you will just see the data
associated with the accounts shown on the sheet for each Hospital. This sheet is linked to the
Income Statement.
Here you should see a screen that looks like the one below. Remember you can use the show/hide icon
to change the view to annual or monthly depending on what level of detail you are providing. Simply
enter the values for each account into the sheet. Once you have entered all the revenue amounts for
each payer, be sure to select the SAVE button to write this to the database.
6) Expenses (Input) Sheet - no longer linked to the Income Statement.
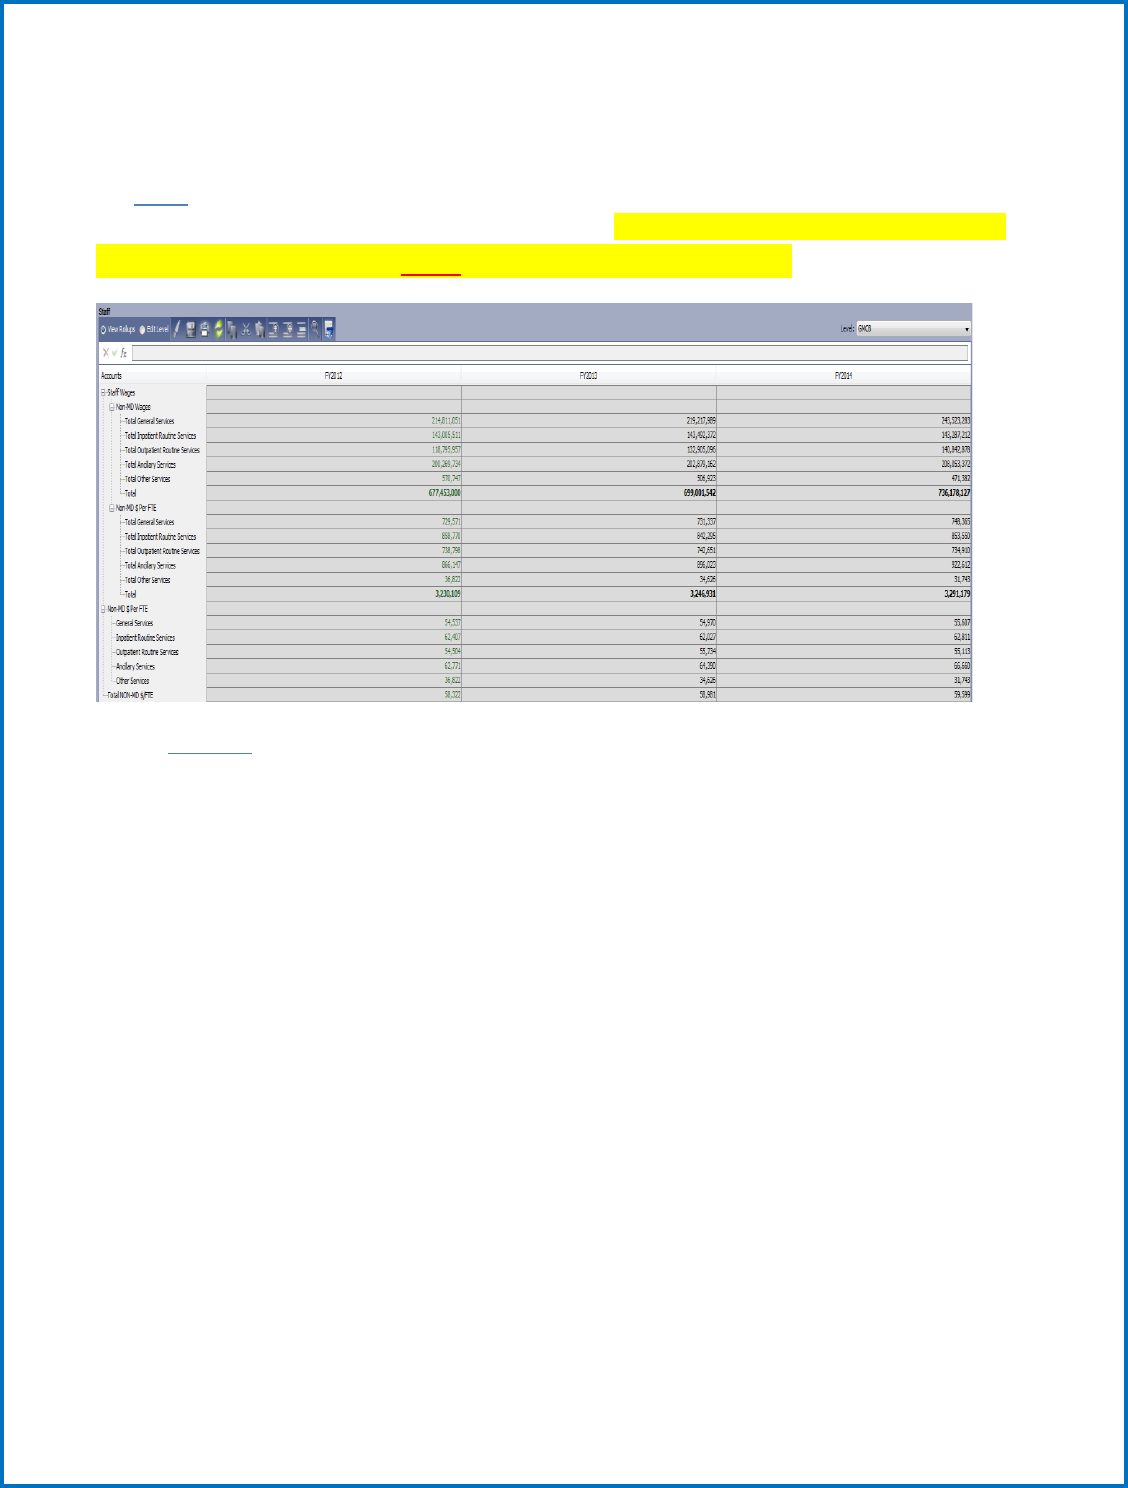
7) Staff/FTE (Input) Sheet
To provide your FTE information for the budget, you navigate to Sheets > Staff/FTE.
Useful Tip: Use the change dimension icon (wheel) to re-sort your vertical dimensions first by
Department and then by FTE Class (shown below) to get the best view for imputing data.
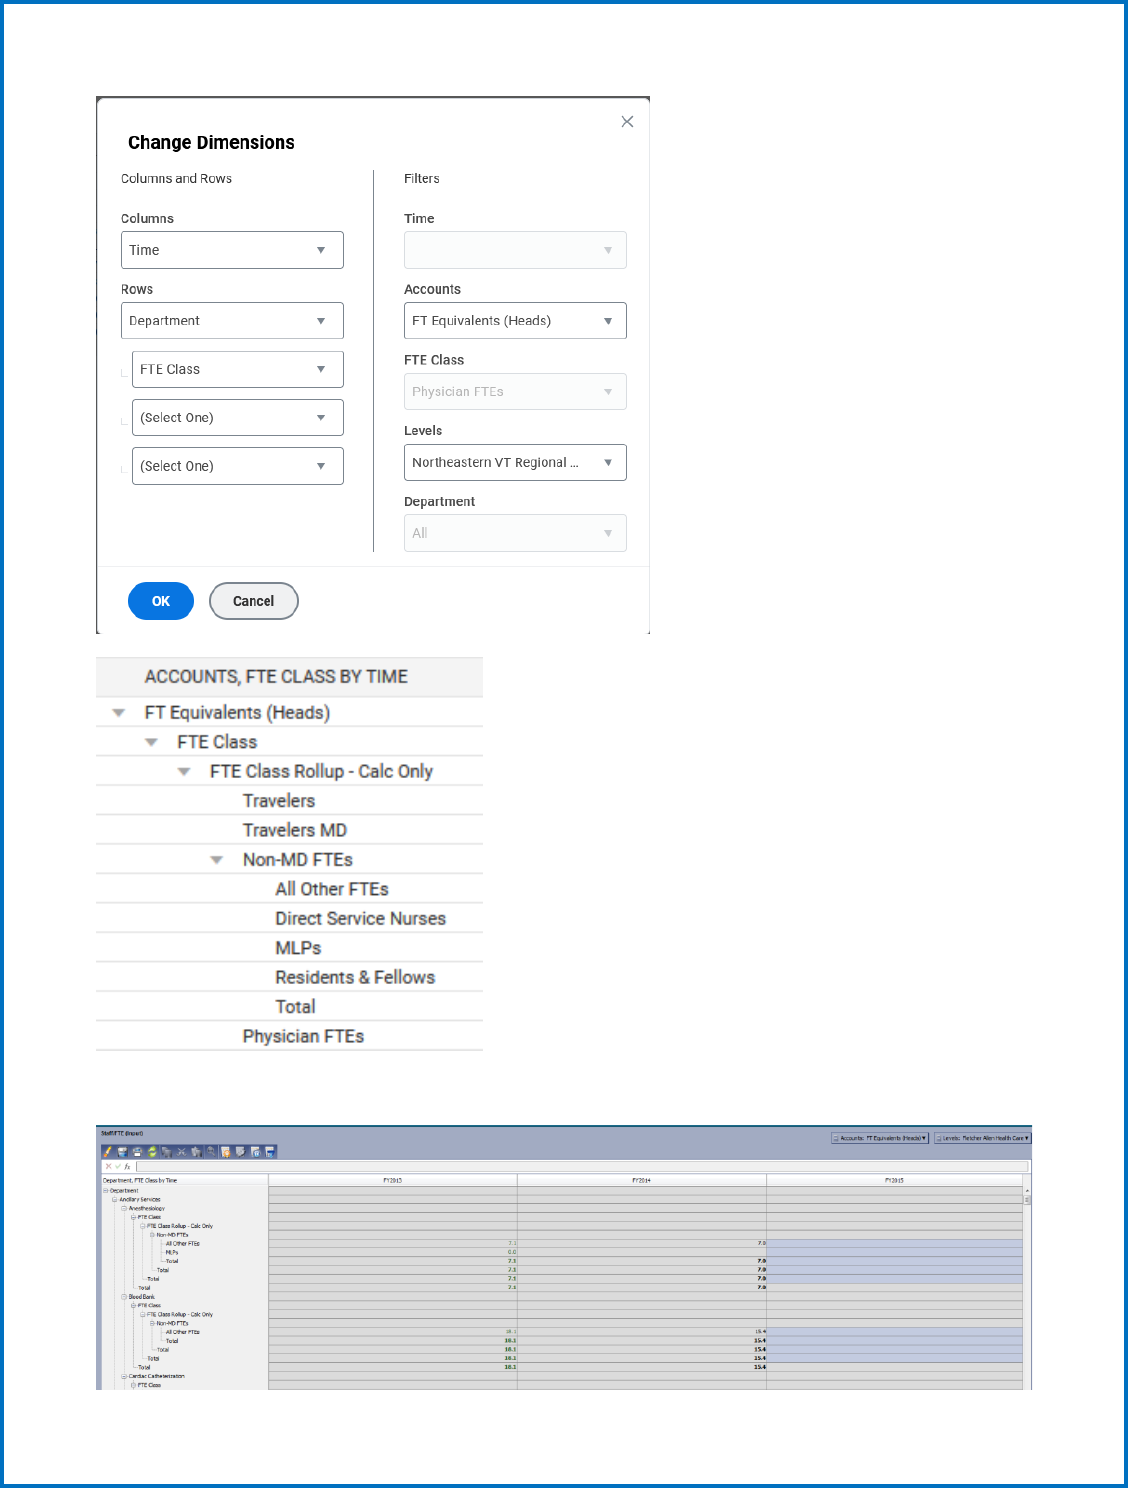
26
Once this is complete you will be able to input your FTEs by staff FTE Class as shown below:
27
Note: You will not need to “breakback” FTEs into monthly data. A formula has been built in to show
the total FTEs for each month.
The Staff sheet is a standard sheet that pulls in wages from the expense sheet and divides them by the
FTEs to show Wage per FTE calculations for service areas. Once you have entered all the FTEs for each
department, be sure to select the SAVE button to write this to the database.
8) Capital
The Capital Budget includes a Summary sheet, a non-CON detail sheet, and a CON capital detail sheet.
They all require a little different input as follows.
Non-CON and CON Capital Detail
Populating the Con Capital and Non-CON details follow the exact same process, but simply require input
on two separate sheets as denoted in the system. These are modeled sheets that allow you to add rows
as necessary by clicking the plus button as shown below. The screen shot is a table of the required
input.
As in previous years, the Capital Budget shall separately report both non-CON capital expenditures as
well as proposed CONs for future years.
Capital budget projects greater than $500,000 shall be itemized.
Projections should include the amount of capital related to new CON approvals that were approved
during previous budget year.
Capital budget items reported in the budget review does not exempt that capital item from CON review
should jurisdiction be asserted later.
There is a column with a drop-down menu for you to identify the type of capital expenditure, whether it
is a replacement, upgrade, or new service.
28
Replacement - Capital items that are purchased to replace worn out items (Example: roof)
Upgrade - Capital items that replace and/or significantly enhance the services previously rendered by
the “old” capital (Example: computer system)
New Service - Capital purchases intended to support or provide new capabilities or services (Example:
MRI)
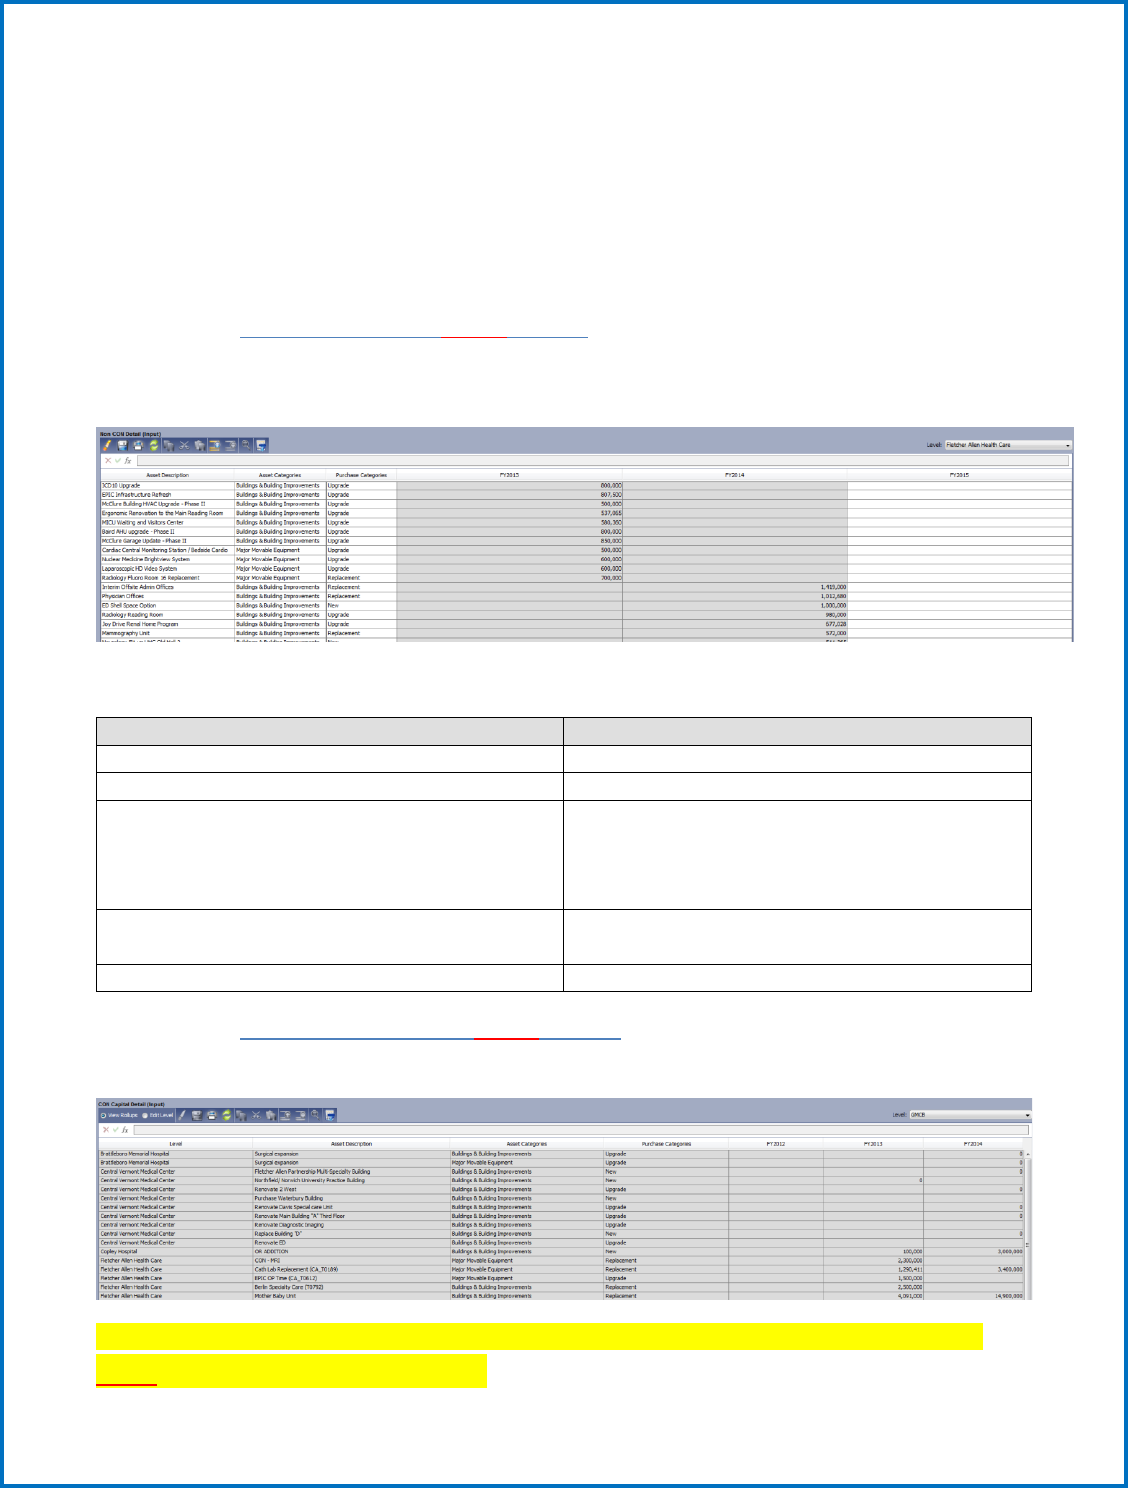
a. Non-CON Detail (Input) Sheet
This is a modeled sheet (for Non-CON greater than $500K). Data is shown along the timespan. A list of
the columns on the sheet and their entry requirements are below:
Column Name
Input Needed
Level
Choose the Hospital from the drop-down menu
Asset Description
Enter a free text description of the Asset
Asset Categories
Choose from drop-down menu: Land & Land
Improvements, Buildings & Building
Improvements, Fixed Equipment, or Major
Movable Equipment
Purchase Categories
Choose from drop-down menu: New,
Replacement, or Upgrade
Timespan
Enter amounts along the timespan
b. CON Capital Detail (Input) Sheet
For unapproved CON plans, column entries are the same as the Non-CON Detail sheet.
Once you have entered all the Capital Expenditure amounts for each category, be sure to select the
SAVE button to write this to the database.
29
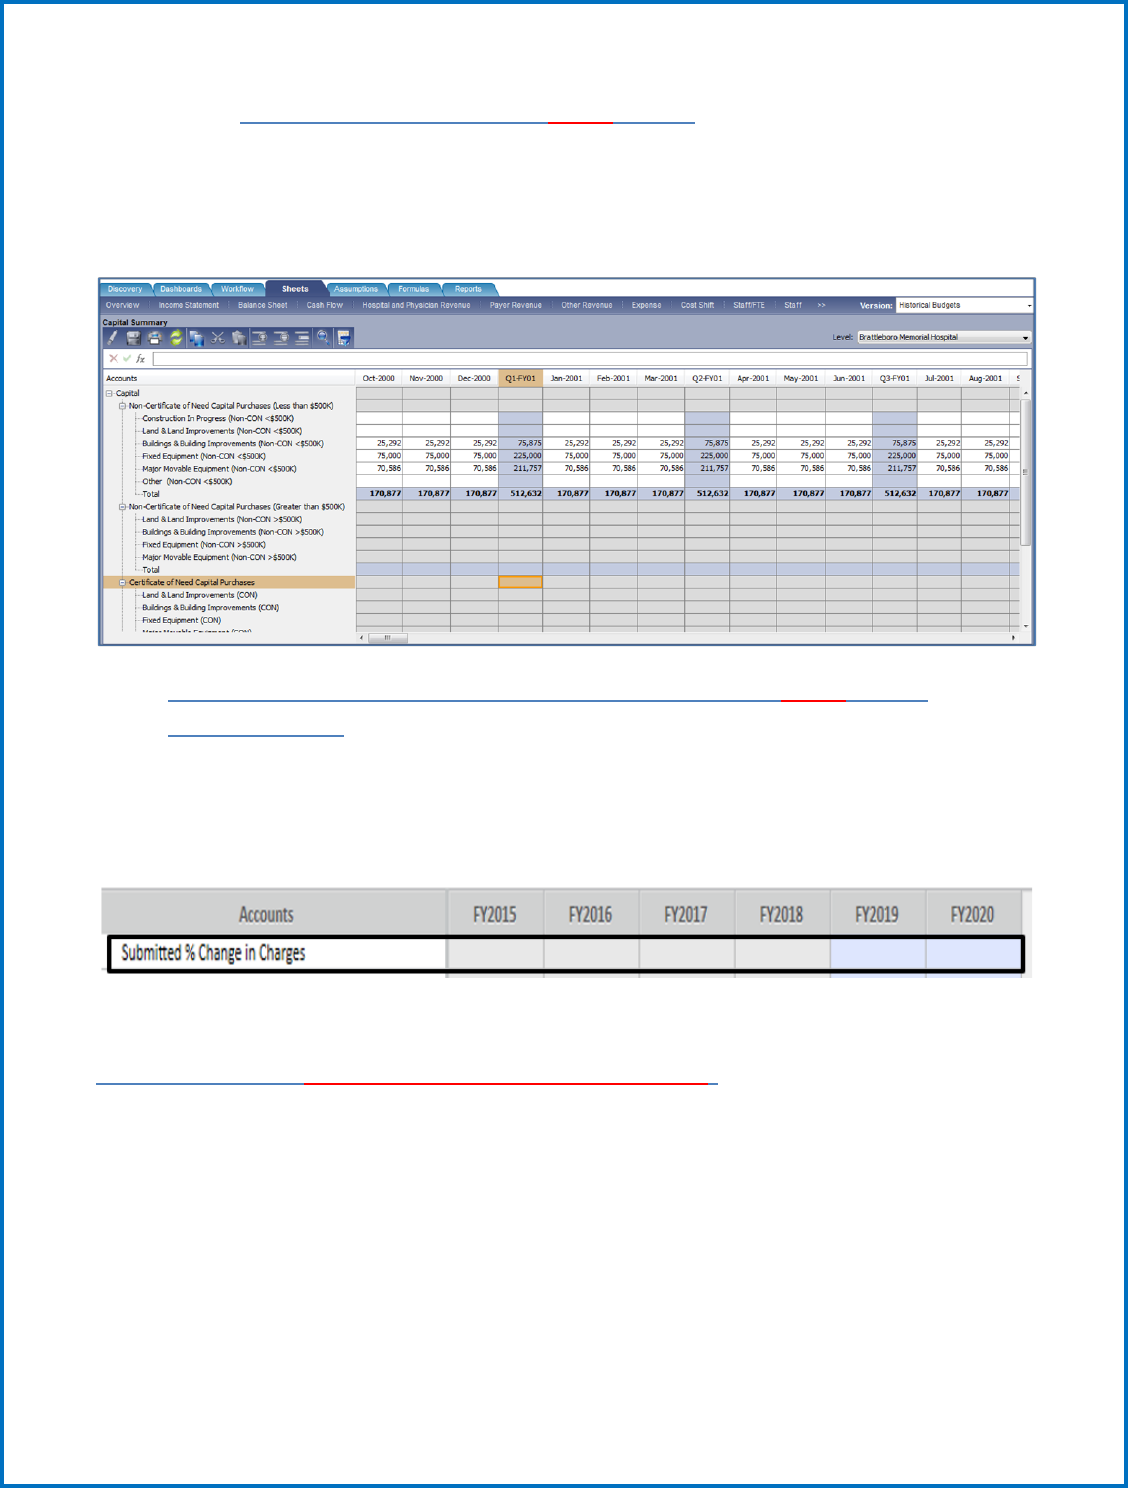
c. Capital Summary (Partial Input) Sheet
The only data entries needed on this sheet are the accounts under the Non-Certificate of Need Capital
Purchases (Less than $500k) rollup. This is populated at the top of the Capital Summary page. All other
capital detail provided on other pages is automatically linked here and totals at the bottom for your
total capital budget.
9) Percent Change in Charge (previously called Rate) (Input) Sheet
(Budgets only)
Percent Change in Charges is a very basic sheet with just two accounts that need input. All that is
required on this sheet is that you populate the annual percent change for the year for the Submitted %
Change in Charges (this can be done by using the break-back functionality). Note: This sheet may
provide additional accounts later.
Outputs generated from your Input (please review)
Cash Flow Sheet (only used for Actuals submissions)
No input required. The Cash Flow sheet shows a list of accounts pulling from both the Income
Statement and Balance sheet. The accounts on this sheet are almost all formula-driven and do not need
to be edited. There is a check at the bottom of the sheet that should be 0 if everything balances.
Note: If a hospital finds it needs to make an adjustment to bring cash flow in balance, consult with the
GMCB staff.

30
Cost Shift Sheet
No input required. The cost shift sheet is a calculated sheet. It is a non-standard sheet called a “cube
sheet” and includes Levels, Accounts and Payer Type. The cost shift sheet contains formulas that
calculate your cost shift values. This information is used to evaluate your budget and the cost shift
information is reported to the legislature each year.
31
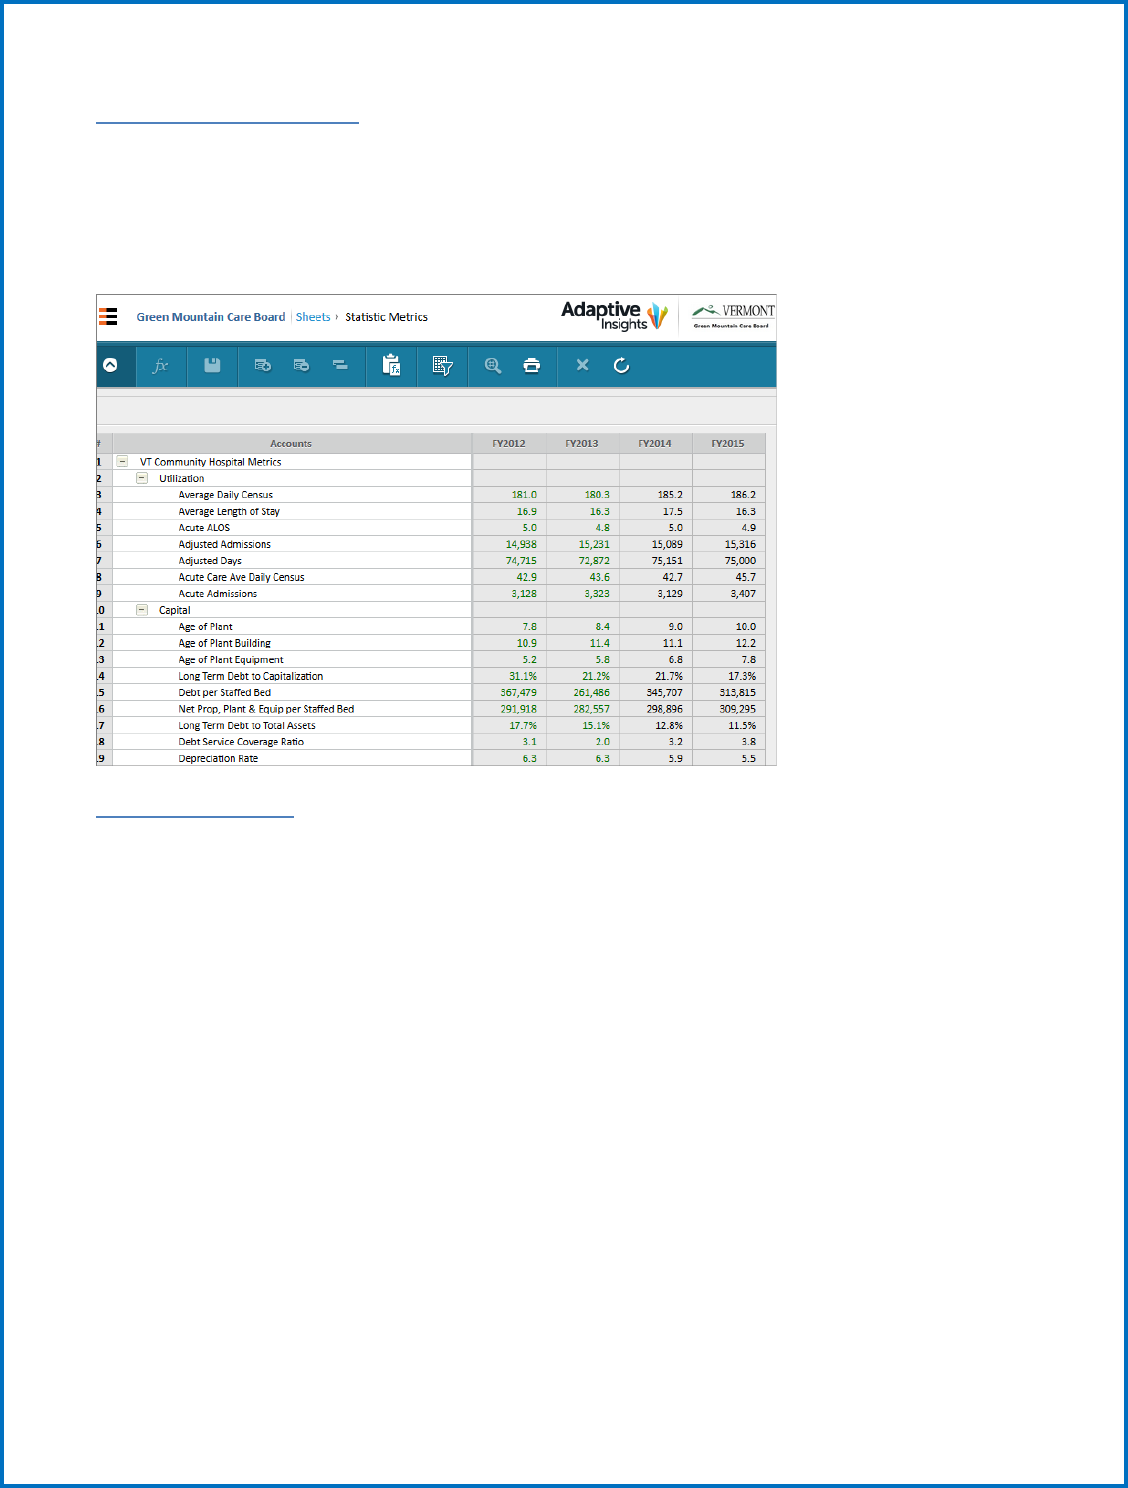
Statistic Metrics Sheet
No input required. This sheet shows all metrics for Utilization, Capital, Revenue, Product, Cost, Cash,
Units and Payer. The sheet will show the formula being used by clicking on a specific cell. If data has not
been entered for Expenses some metrics will return a zero or incorrect information .
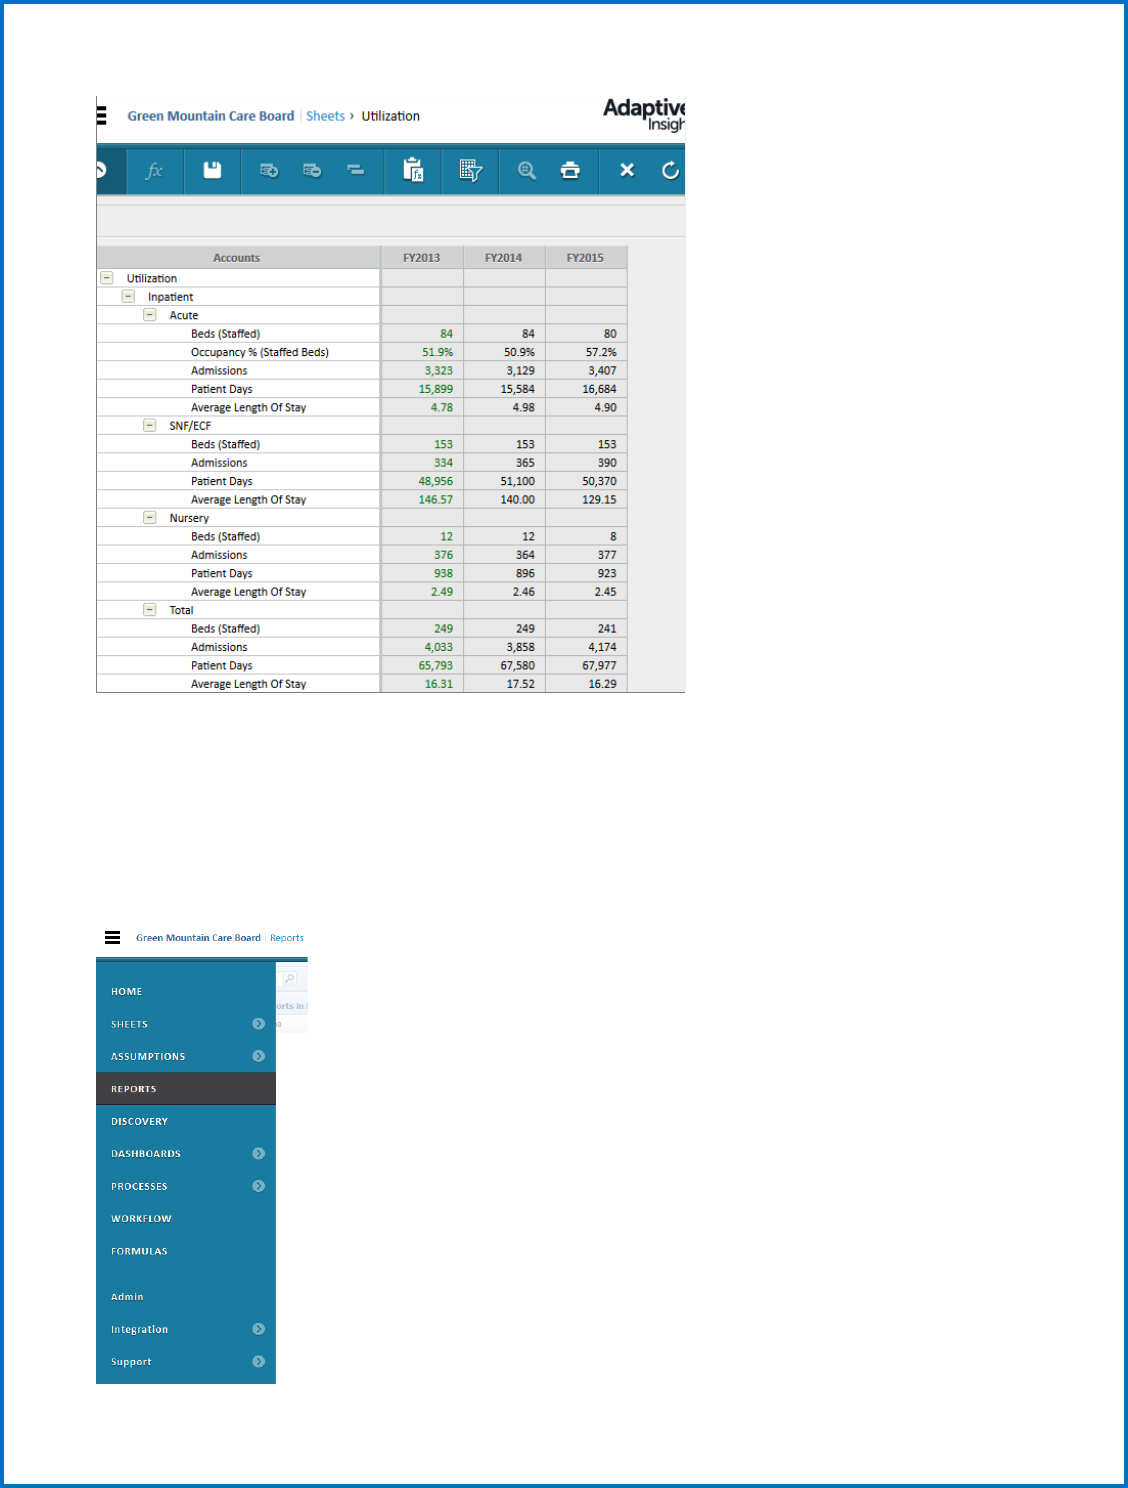
Utilization Sheet
No input required. This sheet summarizes key utilization statistics and metrics. This sheet shows
Utilization calculations for Inpatient and Outpatient Departments, as well as Ancillary and Adjusted
statistics.
32
Viewing Edits and Reports for input validation
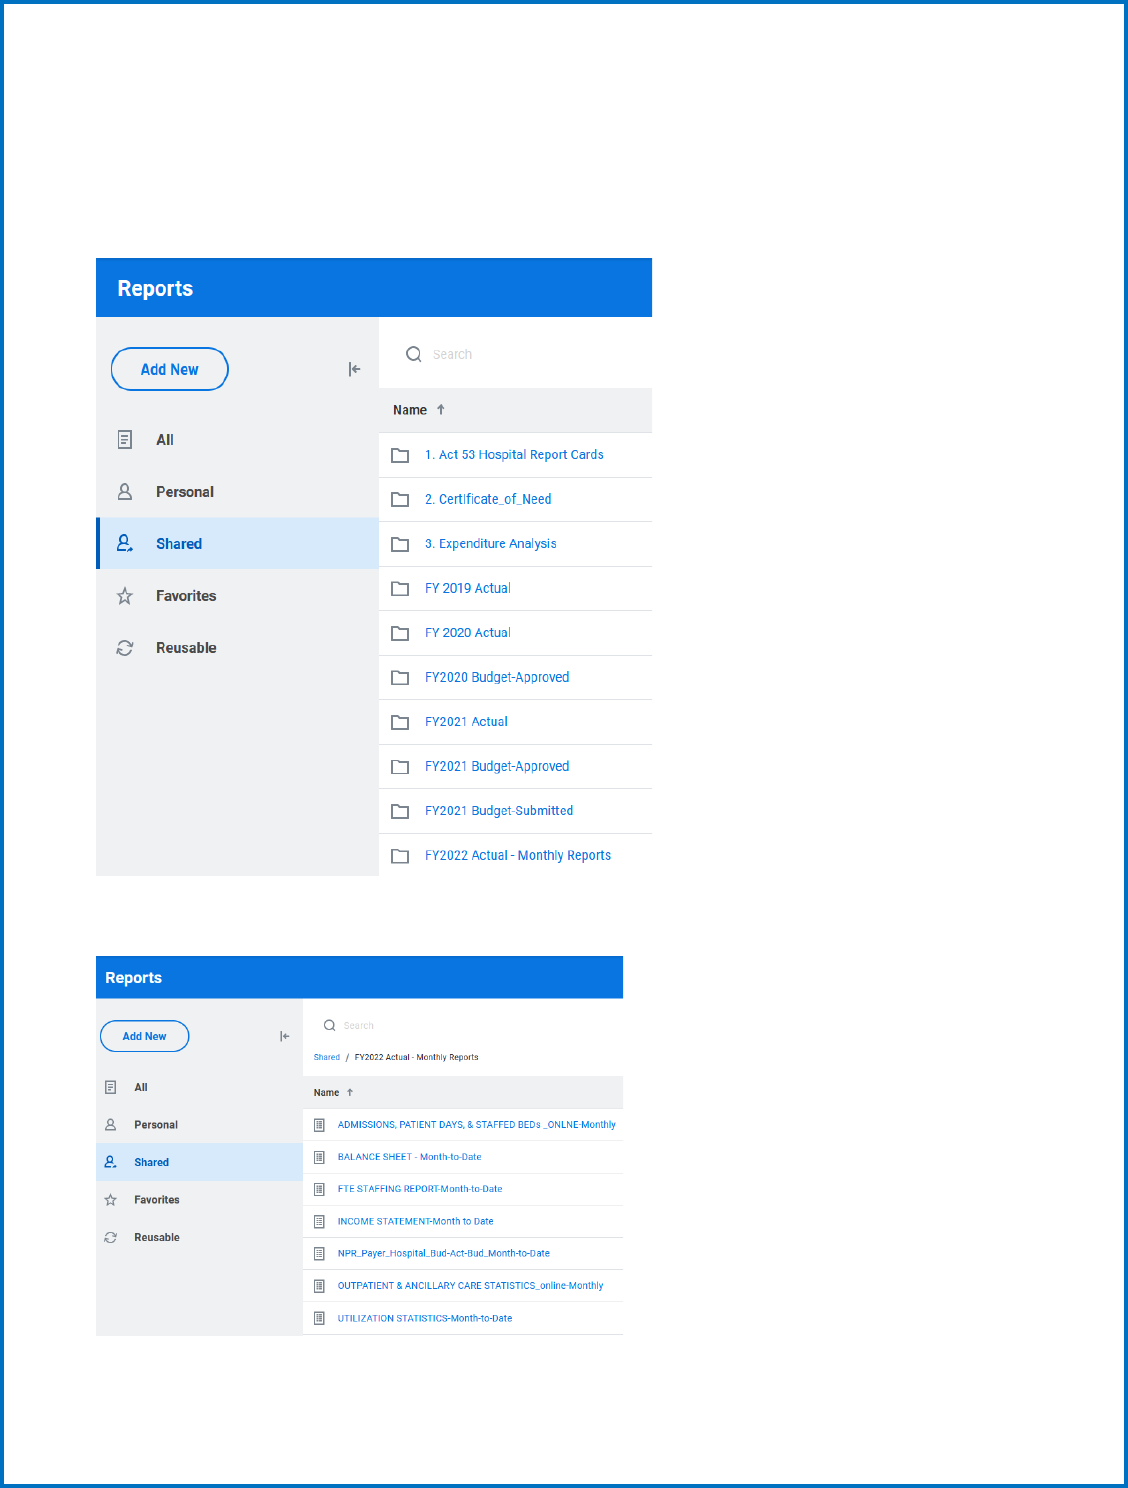
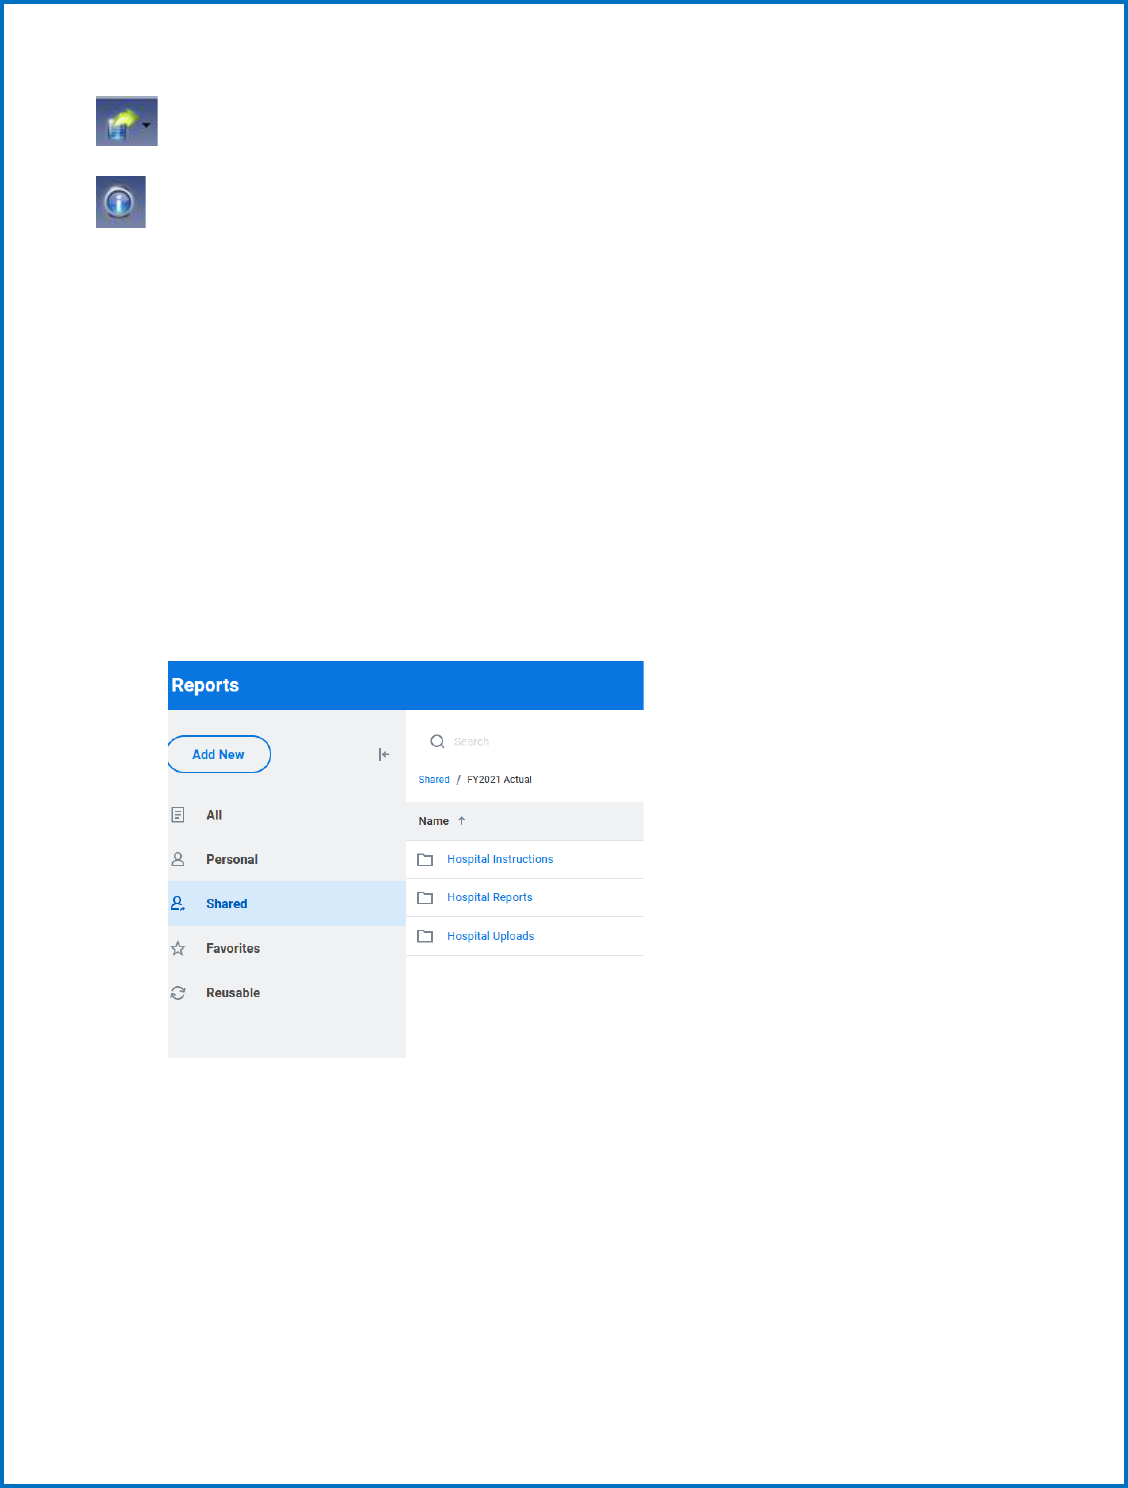
As shown below, select “reports” in your dropdown menu to find your edits and budget reports. The
reports will help you validate your input. Run the edits report first to identify the accuracy of your input.
Once the edit report is reviewed for accuracy, then run the additional reports to see if they compare
accurately with your internal budget documents.
33
Click Shared Reports to expand the list of folders underneath.
You can click on each folder to see the reports inside.
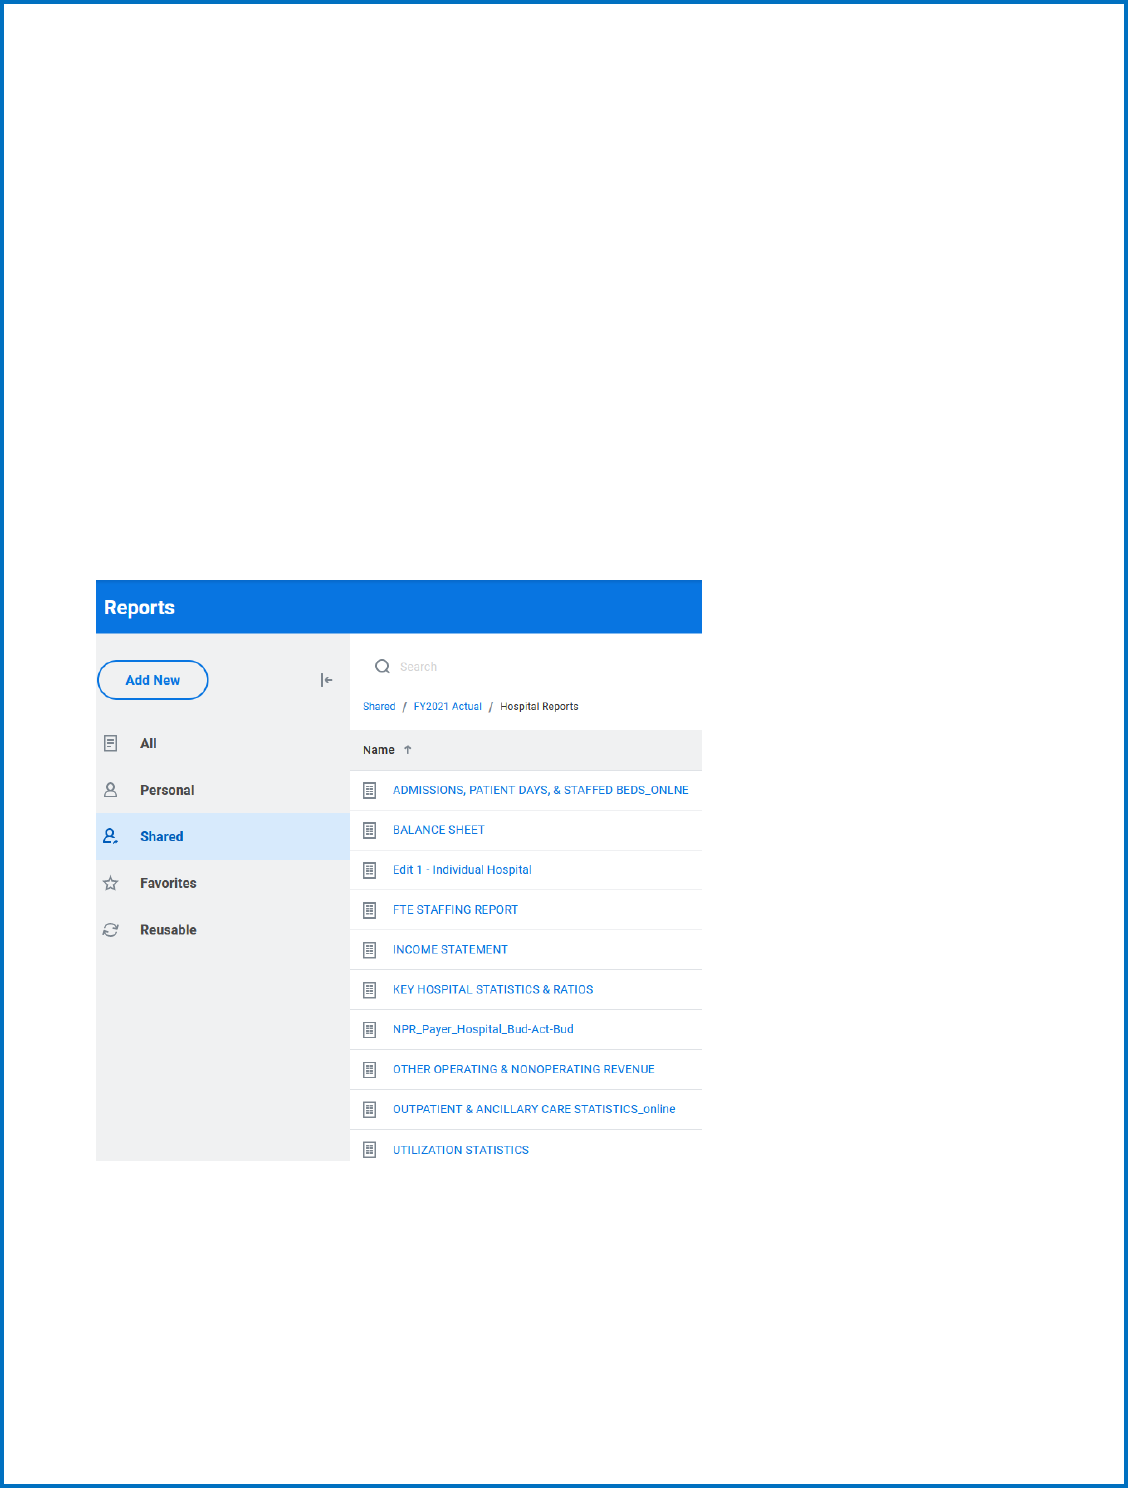
Most reports are already prepared and just require you to “run” them by:
34
• Clicking on the desired report, and
• Selecting “Run Report”.
The reports for the Green Mountain Care Board are built with sufficient flexibility to allow for automatic
updating of timeframes and budget version adjustment using parameters selected from prompts at the
time of running the requisite report.
The following is a quick guide to the adjustment of these parameters to pull in the appropriate
information into the reports. The guide uses the report labeled “INCOME STATEMENT” from the
Hospital Reports folder of Adaptive to serve as a guide for generating the report and validating the
information contained therein.
To run the report and receive the requisite reports from the Home area of Workday Adaptive Planning
go to the Reports tab and select Shared, select the folder for the Actual or Budget year, select the
Hospital Reports folder if applicable then select the “INCOME STATEMENT” or 1. SUMMARY
STATEMENT OF REVENUE & EXPENSE” report.
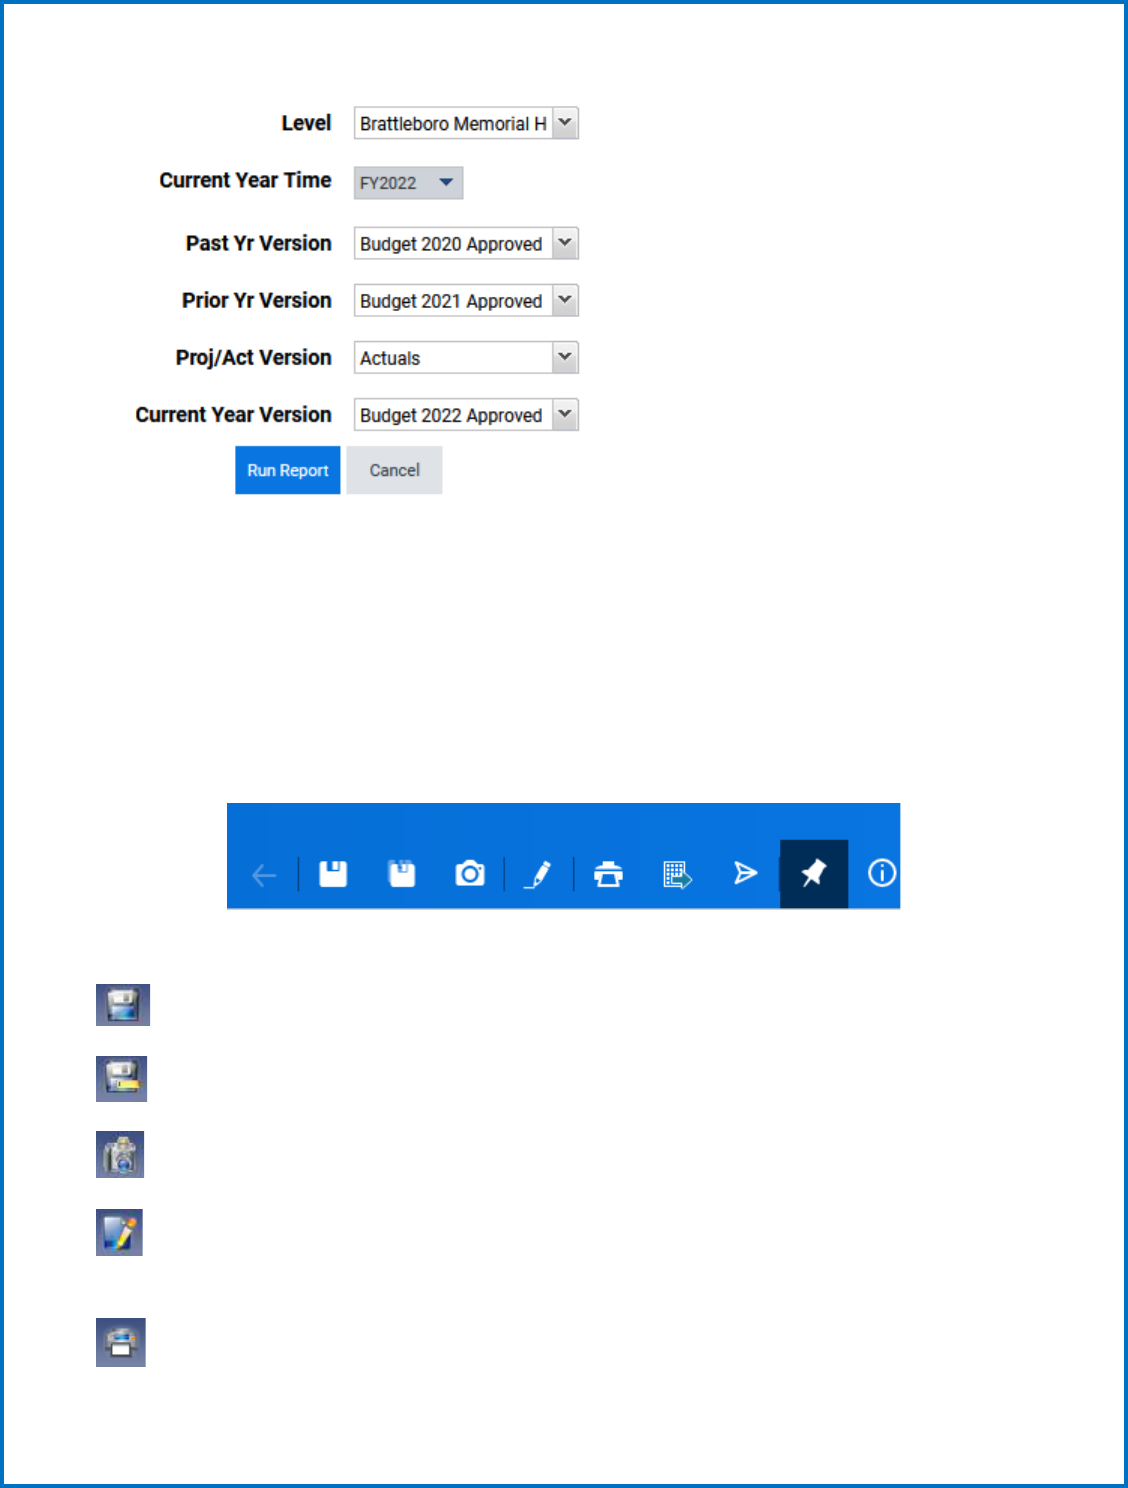
Upon selection of the report, you will receive the following prompt within Workday Adaptive Planning:
35
This provides you other options to change the report, but as previously noted we have standardized the
report for you to automatically display what you are most likely to want to see. The Level prompt allows
you to select the Hospital you would like to which the correlating report pertains. The Level will only be
an option if you have access to another hospital’s information.
You will also notice a toolbar in the upper right corner of the report:
The functions of each button on the toolbar are as follows:
- SAVE – This will SAVE any changes you made to the report
- SAVE As – SAVE the report with a different name
- SAVE As Snapshot – SAVE the report as a snapshot with the current values in place
- Modify Report – Allows you to modify what you see on the report (See following section on
Creating Reports)
- Printable View – Exports the report into an Excel file
36
- Export As – Allows you to choose whether you want to export the file to Excel or PDF
- Show Information – Shows information on the report
When looking at the actual data in the reports, you can expand and compact rollups by using the + and –
buttons. This allows you to see data with more detail if you wish, or at a more summary level if
preferred.
Currently, we have set up most of the reports to export to EXCEL (there will be a green icon next to the
report name). However, some reports are viewed within the browser and are called “online” reports
(these reports will have a blue icon next to the report name).
Submit (upload) your actual or budget reports
Upload any required reports into the appropriate folders such as your Narrative, Oath, Appendices
Workbooks, and Responses to HCA. Most recent Community Health Needs Assessment (CHNA) and/or
work plan and Schedule H of 990.
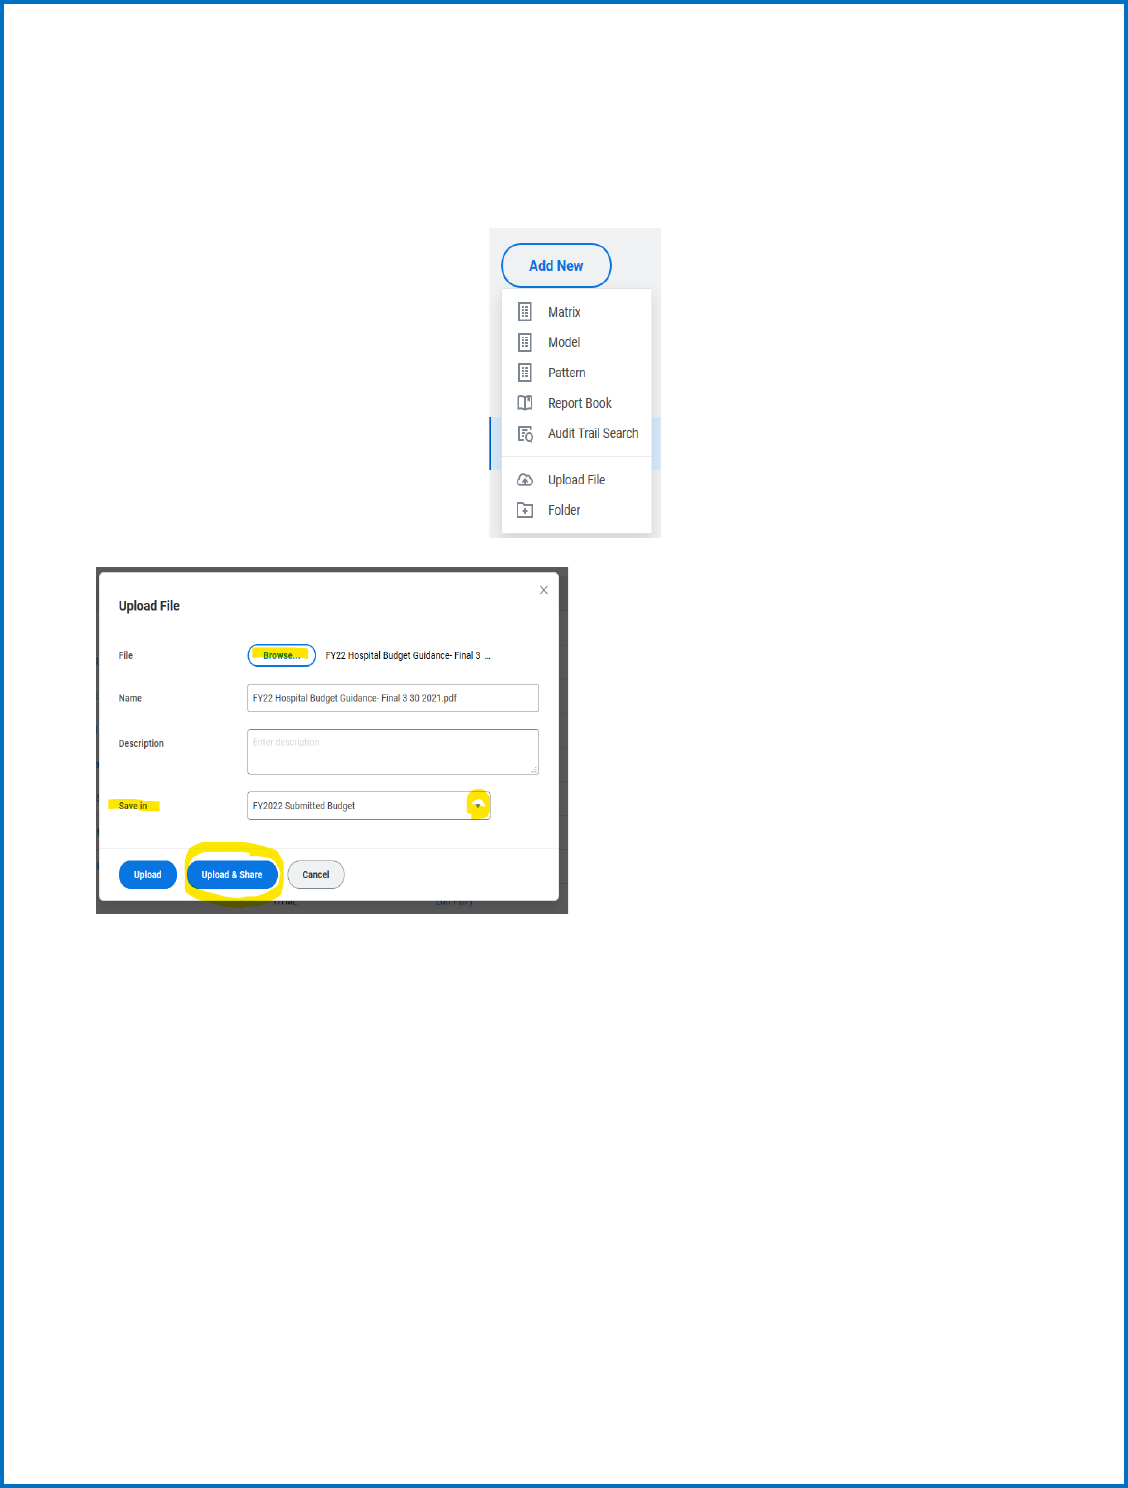
Go to Reports > Overview
Click Add New and select Upload File
Browse to locate the file you want to upload. Select the file and select Open. The path to the file you
select populates in the File field and the name of the file populates in the Name field. Optional. Change
the name to reflect how you want to identify the report in the Reports overview.
37
Optional. Add a description for the file you are uploading. The text that you enter here appears as hover
text for the report. Save in the file as a personal or Shared reports, from the drop-down menu.
Find the directory/folder to save your report such as Hospital Uploads.
Upload & Share option becomes available
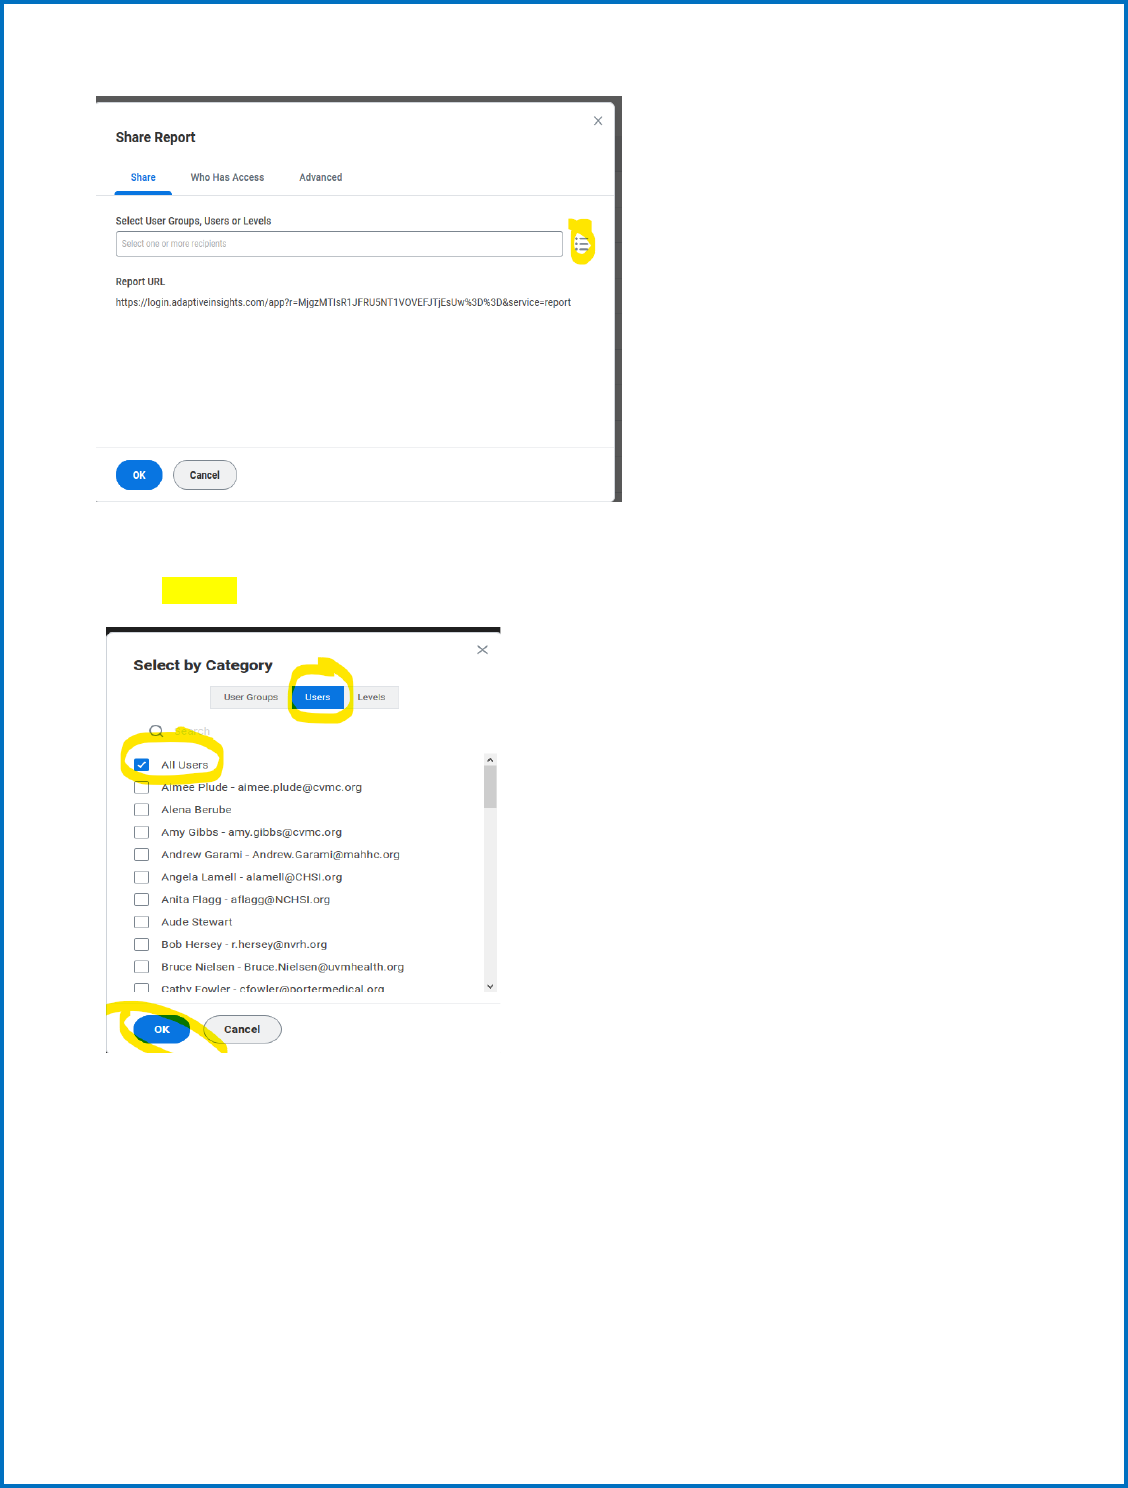
Share Report: Share tab: Select user groups, users, or levels with which to share. A Select by Category
tab comes up from the contents drop-down
38
Select by Category
Users : All users.
39
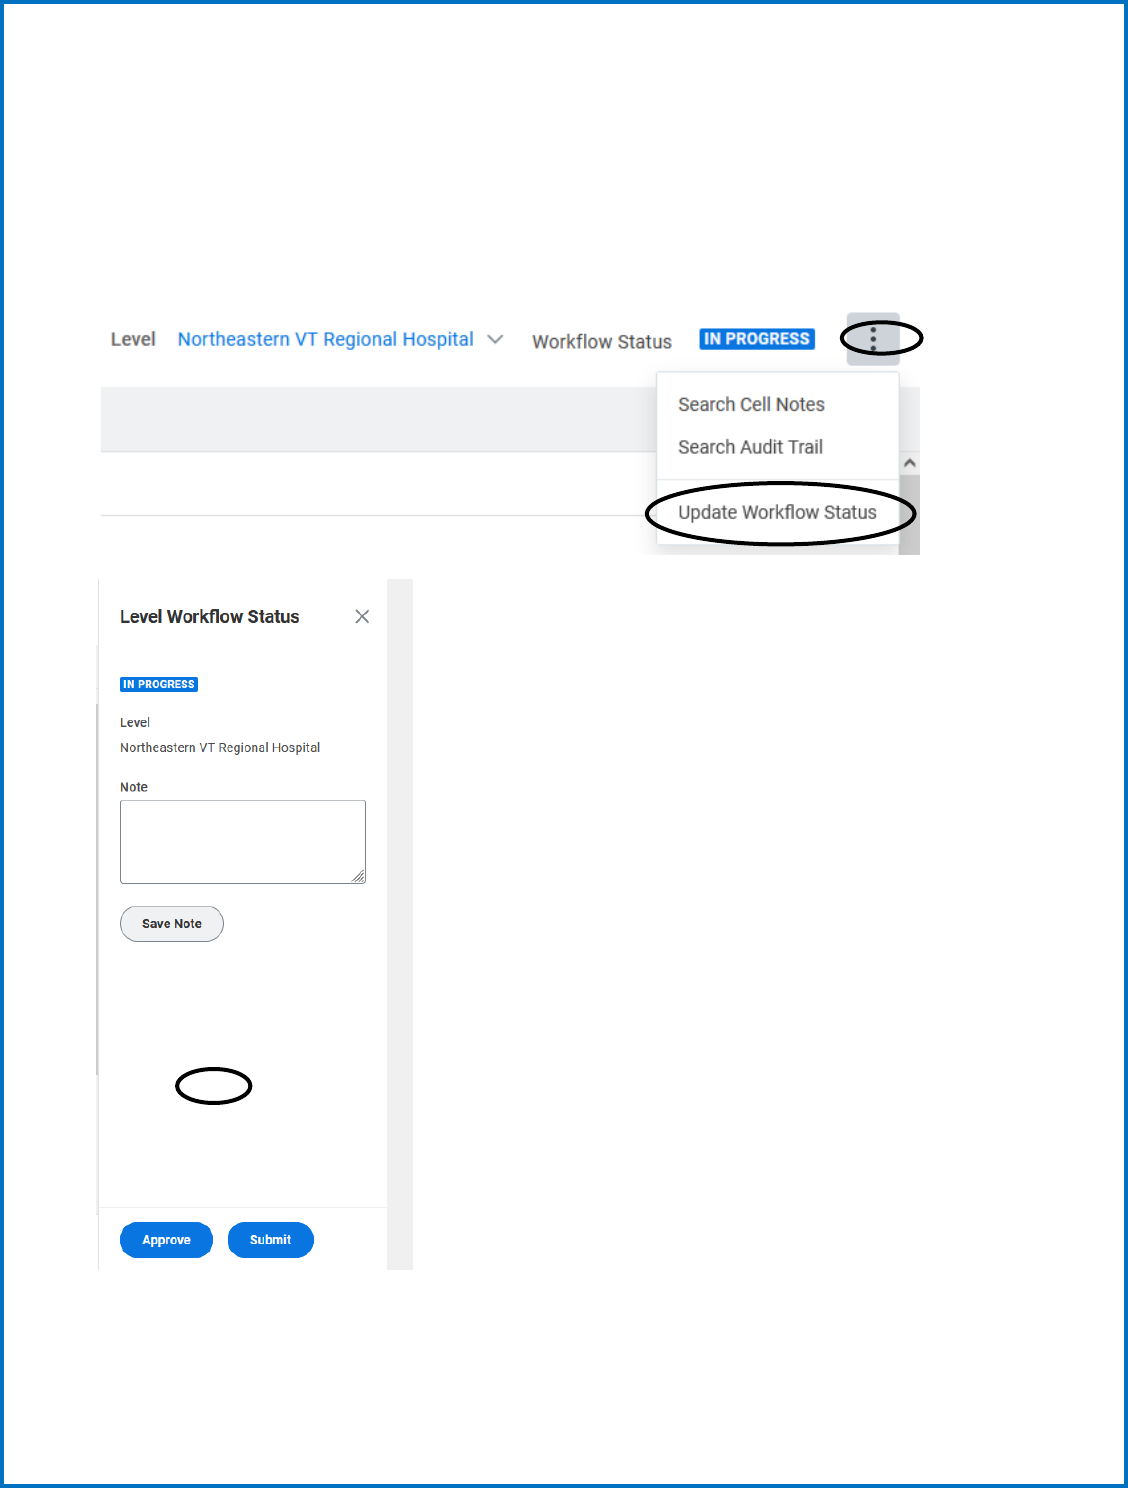
SUBMIT your Budget or Actuals
Once you are satisfied with the financial results of your data input, navigate to the Overview as shown
below.
Populate notes as appropriate and click Submit. You are done!

40
RATIOS, STATISTICS, AND INDICATORS
The budget file includes a calculation of ratios, statistics and indicators that are to be used for evaluating
and comparing the hospital budget submissions. State peer group data is compiled from the budget
submissions and compared to regional and national peer groupings as cited below. Each hospital statistic
is compared against median values.
GMCB compares each hospital’s ratios, statistics and indicators to the state, regional and national peer
groupings. The statistics are grouped into categories that assess the hospital’s cash, productivity, costs,
debt and capital investment, payer mix and profitability, per unit values, and utilization. The formulas
used to calculate each statistic are listed below following the peer group descriptions.
PEER GROUPS
The peer group for the State will be based upon the acute care bed size of the hospital for some reporting.
The groupings will be beds from 25-99 beds, 100-249 beds and over 400 beds if applicable.
Critical access hospitals will be considered their own Vermont peer group.
The regional comparative groups will be select not-for-profit hospitals - PPS New England and Northeast
hospitals, CAH Northeast.
The national comparative group will be select other not-for-profit hospitals and CAH hospitals.
The University of Vermont Medical Center maybe compared to academic medical centers and or tertiary
hospitals as well as teaching hospitals were appropriate.
Comparative Data Source:
Flex Monitoring Team - for Critical Access Hospitals
Fitch Ratings – Fitch Analytical Comparative Tool Analytical Comparative Tool (

41
RATIOS, STATISTICS, AND INDICATORS - FORMULAS
The actual formulas are also in the Adaptive tool though they may reflect a more technical syntax.
UTILIZATION STATISTICS CALCULATION
Average Daily Census Total IP Routine Days/365
Average Length of Stay Total IP Routine Days/Total Admissions
Acute ALOS Total Acute Care Days/Acute Care Admissions
Adjusted Admissions Total Patient Care Revenue/ (Acute + Nursery +
IP Ancillary Rev)* Acute Care Admissions
Adjusted Days Substitute Days for Admissions in Formula
Above
Acute Care Average Daily Census Acute Care Days/365
Acute Admissions Total Acute Admissions
CAPITAL STATISTICS
Age of Plant – Total Facility Accumulated Depreciation/Depreciation
Expense
Age of Plant – Building/Fixed Equip Accumulated Depreciation (build)/Depreciation
Expense (build)
Age of Plant – Major Movable Equipment Accumulated Depreciation (MME)/Depreciation
Expense (MME)
Long Term Debt to Capitalization Long Term Liabilities/ (Fund Balance + Long
Term Liabilities)
Debt Per Staffed Bed Total Liabilities/Staffed Beds
Net Prop, Plant & Equipment Per Staffed Bed Property, Plant & Equipment – Accumulated
Depreciation/ Staffed Beds
Long Term Debt to Total Assets Long Term Liabilities/Total Assets
Debt Service Coverage Ratio (Net Operating Income + Depreciation +
Amortization + Interest) / (Current Portion of
Long-Term Debt + Interest)
Depreciation Rate Depreciation & Amortization Expense/Gross
Prop, Plant & Equip *100

42
Capital Expenditures to Depreciation Capital Expenditures / (Depreciation +
Amortization)
Capital expenditure growth rate Capital Expenditures/Gross Prop, Plant & Equip
* 100
Capital Acquisitions as a Percent of Total Capital Acquisitions/NPR
Net Patient Revenue (NPR)
REVENUE & PAYER MIX STATISTICS
Deduction % Total Deductions/Gross Patient Revenue
Bad Debt % Bad Debt/Gross Patient Revenue
Free Care % Free Care/Gross Patient Revenue
Operating Margin % Operating Surplus / (NPR+FPP + Other
Operating Revenue)
EBIDA Margin % Operating Surplus + Interest + Depreciation +
Amortization/Total Operating Revenue
Total Margin % (Operating Surplus & non-operating
Revenues)/(NPR +FPP+ Other Operating
Revenue + Non-Operating Revenue)
Outpatient Gross Revenue % Gross Outpatient Revenue / Total Gross Patient
Revenue
Inpatient Gross Revenue % Gross Inpatient Revenue / Total Gross Revenue
SNF/Rehab/Swing Gross Revenue % (Chronic/Rehab Gross Revenue + SNF/ECF Gross
Revenue + Swing Bed Gross Revenue) / Total
Gross Rev
All NPR/FPP % of Gross Hosp Rev. with DSH & GME NPR+FPP / Gross Patient Revenue
All NPR/FPP % of Gross Hosp Rev. without DSH & GME (NPR+FPP-DSH-GME Phys –GME Hosp.) / Gross
Patient Revenue
Medicare NPR/FPP% of Gross Rev incl Phys (Medicare NPR+FPP+ Physician Medicare
NPR+FPP / Medicare Gross Patient Revenue
Medicaid NPR% of Gross Rev incl Phys (Medicaid NPR+FPP+ Physician Medicaid
NPR+FPP) / Medicaid Gross Patient Revenue

43
Commercial/Self Pay NPR% of Gross Rev incl Phys (Commercial/Self Pay NPR+FPP+ Physician
Commercial/Self Pay NPR+FPP) /
Commercial/Self Pay Gross Patient Revenue
PRODUCTIVITY STATISTICS
Adjusted Admissions Per FTE Adjusted Admissions/ Non-MD FTES
FTES Per 100 Adjusted Discharge Non-MD FTE / Adjusted Admissions * 100
FTES Per Adjusted Occupied Bed Total Non-MD FTE/ (Adjusted Pat Days/365)
Return on Assets Net Income/Total Assets
Overhead Expenses, with Fringe Benefits, General services expense plus fringe benefit
as a % of Total expenses expense/Total expense.
COST STATISTICS
Cost Per Adjusted Admission Total Expenses/Adjusted Admissions
Salary Per FTE (Non-MD) Non-MD Salaries & Wages /Non-MD FTE
Salary & Benefits Per FTE (Non- MD) Non-MD Salaries/Wages & Fringe Benefits/
Non-MD FTE
Salaries to NPR/FPP Salaries Expense/NPR+FPP
Fringe Benefit %-Non-MD Total Non-MD Fringe Benefits / Non-MD
Salaries
Compensation Ratio (Salaries + Fringe Benefits + Physician
Fees/Salaries/Contracts/Fringe) / Total
Operating Revenue
Capital Cost % of Total Expenses (Depreciation + Amortization + Interest)/ Total
Expense
Capital Cost Per Adjusted Admission (Depreciation + Interest + Amortization) /
Adjusted Admissions
Contractual Allowance % Contractual Allowances/Total Gross Patient
Revenue

44
CASH STATISTICS
Current Ratio (Current Assets + Unrestricted Funded
Depreciation)/Current Liabilities
Days Payable Current Liabilities / (Total Expenses –
(Depreciation + Amortization + Interest)*365
Days Receivable Net Patient Accounts Receivable / NPR* 365
Days Cash on Hand-COVID-19 (Cash + Investments – stimulus funds to be paid
back+ Unrestricted Funded Depreciation (Board
Designated Assets) + Unrestricted Other Board
Designated Assets) * 365 / (Total expense –
(Depreciation + Amortization)
Days Cash on Hand (Cash + Investments + Unrestricted Funded
Depreciation (Board Designated Assets) +
Unrestricted Other Board Designated Assets) *
365 / (Total expense – (Depreciation +
Amortization)
Cash Flow Margin (Net income/loss + Current Depreciation
Expense + Interest Expense +Amortization)
/NPR+ Other Operating Income)
Cash to Long Term Debt (Cash + Funded Depreciation + Other Board
Designated Assets)/Long term debt
Cash Flow to Total Debt (Operating surplus & Non-operating Revenues +
Depreciation +Bad debt +
Amortization)/(Current liabilities and Long-Term
Debt) * 100
Expenses per Day Total Operating Expenses / 365
REVENUE UNIT STATISTICS
Gross Price per Discharge Gross Inpatient Revenues/Total Admissions
Gross Price per Visit Gross Outpatient Revenues/Outpatient Visits
Gross Revenue Per Adjusted Admission Total Patient Care Rev/Adjusted Admissions
Net Revenue Per Adjusted Admission (Total Patient Revenue – Total Deductions) /
Adjusted Admissions

45
PAYER STATISTICS
Physician % of NPR/FPP (less DSH) Physician NPR+FPP/Total NPR+FPP (less DSH)
Medicare Gross Rev as % of Gross Rev Medicare Gross Revenue/Total Gross Revenue
Medicaid Gross Rev as % of Gross Rev Medicaid Gross Revenue/Total Gross Revenue
Commercial & Self Pay Gross Rev. as % of Gross Rev. Commercial & Self Gross Revenue/Total Gross
Revenue
Medicare % of NPR/FPP (less DSH) Medicare NPR+FPP/Total NPR+FPP (less DSH)
Medicaid % of NPR/FPP (less DSH) Medicaid NPR+FPP/Total NPR+FPP (less DSH)
Commercial % of NPR/FPP (less DSH) Commercial NPR+FPP/Total NPR+FPP (less DSH)
DSH % Total NPR/FPP Disproportionate Share/Total NPR+FPP
Medicare % Total NPR/FPP (incl DSH) Medicare Net Rev/Total NPR+FPP (incl. DSH)
Medicaid % Total NPR/FPP (incl DSH) Medicaid NPR+FPP /Total NPR+FPP (incl. DSH)
Commercial/Self % Total NPR/FPP (incl DSH) Commercial NPR+FPP /Total NPR+FPP (incl.
DSH)

46
GLOSSARY
Accumulated Depreciation: A balance sheet account that records the decline in value of capital assets.
Acute Care: Inpatient routine care for patients admitted for greater than 24 hours. (exception – see
Observation care)
Acute Admissions: The number of patients admitted to a hospital for care in a given time period.
Adjusted Admissions/Day: Calculation “adjusts” inpatient data to account for outpatient activity in a
hospital. The statistic is an industry recognized measure to measure overall hospital utilization and is
useful for comparisons among hospitals.
Ancillary Services: Inpatient and/or outpatient tests, exams, procedures that diagnose, treat or support
patient care. These services include lab tests, radiology procedures, surgical procedures, etc.
Amortization: The process of retiring a debt, usually by equal payments at regular intervals over a
specific period.
Available Bed Days: Number of days hospital beds can be used in a year. It is calculated by multiplying
number of days in year by number of staffed beds.
Average Length of Stay: The calculated number of days per inpatient hospitalization.
Acute Average Daily Census: Measure of acute inpatient utilization. This is calculated by dividing
number of acute inpatient days by number of days in a year.
Bad Debt: An expense billed and due but not received. Assumption is that individual has the ability to
pay but will not pay or has disputed the bill. See free care definition that distinguishes bad debt from
free care.
Charge master: a comprehensive listing of items billable to a hospital patient or a patient’s health
insurance provider.
CON: Acronym for Certificate of Need. CON is a regulatory program designed to determine the need for
certain capital projects.
Consumer Price Index: Measure of inflation and changes in the cost of consumer goods. (See the
Bureau of Labor Statistics for more information)
Contractual Allowance: Difference between hospital’s full, established charge and amount due/received
in payment from third party payers.
Co-payment: Cost sharing mechanism. A co-payment requires an individual to pay fixed amount at time
of service, regardless of the cost of service.

47
Cost Shifting: The practice of collecting revenue from one hospital payer to cover costs incurred by
patients unable to pay (or whose costs are not fully reimbursed by other third-party payers).
Deductions from Revenue: Accounting term used to describe reductions from gross revenues.
Examples of deductions: contractual allowance, bad debt, free care. Bad debt, free care is sometimes
referred to as “uncompensated care”.
Depreciation: An expense. Depreciation notes the decrease in value of an asset by allocating the asset
costs over the useful life of the asset.
Free Care: Term used to recognize loss of revenue billed/due but not received. Considered “free”
because individual has limited or no ability to pay, as established by the hospital or other provider.
Charity care deductions are defined as the difference between gross charges and any subsequent
reimbursement that may be received from, or on behalf of, those individuals determined eligible for
“free care”. See bad debt definition that distinguishes bad debt from free care.
Fringe Benefits: An expense. Refers to benefits provided by employers as part of employee
compensation. Examples of common benefits: health and dental insurance, FICA, pension plan.
Full Time Equivalent (FTE): The number of hours worked that add up to a full-time employee - 2080 hours
in one year.
Nurses – The number of direct services nurses will be reported. Nurses working in general services
cost centers should not be counted as direct service staff. Direct service nurses do not include
traveling or agency nurses.
Temps/Travelers – Temporary positions hired to meet staffing shortages should be separately
identified.
Physicians - The number of active practicing physician employed at the hospital shall be reported.
Fund Balance: This is a balance sheet account. What an organization will have “left over” once it pays
out all it owes. Assets less liabilities equal fund balance.
Global Budget: Budget or expenditure target for health care. Allocation of monies could be managed by
a controlled entity, with broad policy direction provided from government.
Gross Charge Per Adjusted Admission or Day: A unit measure. Amount charged to payer for services in
an average stay/day. Calculation factors amount of inpatient and outpatient care provided and is useful
for comparisons among facilities.
Gross Patient Revenue: A hospital’s total billed revenue for providing goods and services to patients.
This is the total revenue amount billed before contractual allowances, commercial discount agreements,
bad debts and free care are deducted.
Inpatient: Hospital stay. Patient provided with room, board, and continuous nursing care.
Inpatient Day: Each 24-hour day a patient stays in hospital.

48
Interest: Cost incurred for borrowing funds and usually expressed as a percentage of the total loan.
Investments: Balance sheet account. This refers to financial instruments that may earn income such
as stocks, mutual funds, bonds, etc.
Liabilities (current): What an organization owes that will/should be paid within the year.
Long Term Liabilities: Refers to debt that will be paid over period greater than one year.
Medicaid: Federal and state funded program that provides health care benefits to persons meeting
various eligibility requirements (low income, certain medical conditions).
Medicare: Federally funded program providing hospitalization and medical care services for individuals
65 years or over OR for individuals meeting other eligibility requirements. Income level is not a factor in
eligibility.
Net Patient Revenue: Monies hospital will receive for services rendered. It is the amount resulting after
contractual allowances, commercial discounts, and free care are deducted from gross charges.
Note: Hospitalist revenues should be recorded as “Other” under Inpatient Routine Services if it is
not recorded in the other acute care cost centers.
Net Revenue: Total patient charges and “other operating income” minus all deductions (contractual
allowances, bad debts, uncompensated care). The difference between this and Net Patient Revenue is
the inclusion of “other operating income”.
Non-MD Salaries & Wages: All non-physician salaries and wages. Contractual costs should be reported
as non-salary costs.
Non-operating Revenue: Revenue earned by hospital that is not related to patient care – income from
investments, contributions, sales to other organizations, etc.
Observation Patients: Patients who are hospitalized overnight and expected to be discharged within 48
hours.
Occupancy: Percentage calculation of hospital beds in use. Represents number of patient days of
service divided by number of available bed days.
Operating Expenses: All input costs required to provide goods and services to patients. This includes
salaries, fringes, insurance, professional fees, depreciation, interest, etc.
Operating Expense/Adjusted Admission or Operating Expense/Adjusted Patient Day: Measurement of
costs to provide services for average inpatient stay or day. Calculation factors in outpatient care to
allow for comparisons among facilities.
Operating Surplus: (sometimes called Operating Margin or Profit) Net revenues less expenses resulting
in profit.

49
Other Operating Revenue: Revenue earned by hospital that is indirectly related to patient care.
Examples: income from cafeteria, parking, physician office rentals, etc.
Outpatient: Individuals who receive services in the hospital but do not stay overnight.
Payers: State program or federal program or insurance company that pays the bill for health care
services.
Providers: Hospitals, licensed health care professionals, or group of hospitals that provide health care
services.
Rate: the amount of increase given to the charge master prices.
Revenue: See Gross Patient Revenue and Net Revenue
Self-pay: Individuals who pay for their own care without using an insurance plan.
Tertiary Care: Services provided by highly specialized providers (e.g., neurologists, neurosurgeons,
intensive care units). Such services frequently require sophisticated equipment and support facilities.
