
Last updated: 4/16/2024
Office Connect for Financial Reports
I. What is Office Connect ......................................................................................... 1
II. Accessing Office Connect ...................................................................................... 1
III. Navigating Office Connect .................................................................................... 2
IV. Report Elements ................................................................................................... 3
V. Refreshing a Report .............................................................................................. 7
VI. Ad-Hoc Reporting ................................................................................................. 9
VII. Reporting Tips and Limitations ........................................................................... 14
Office Connect for Financial Reports
1
Last Updated: 4/16/2024
I. What is Office Connect
Office Connect is a software that uses data from Workday to create reports in Excel, documents
in Word and/or presentations in Power Point. Office Connect is available for users with the
Financial Analyst role in Workday. This guide will walk you through using Office Connect to
refresh existing Office Connect reports as well as create ad-hoc reports within Excel.
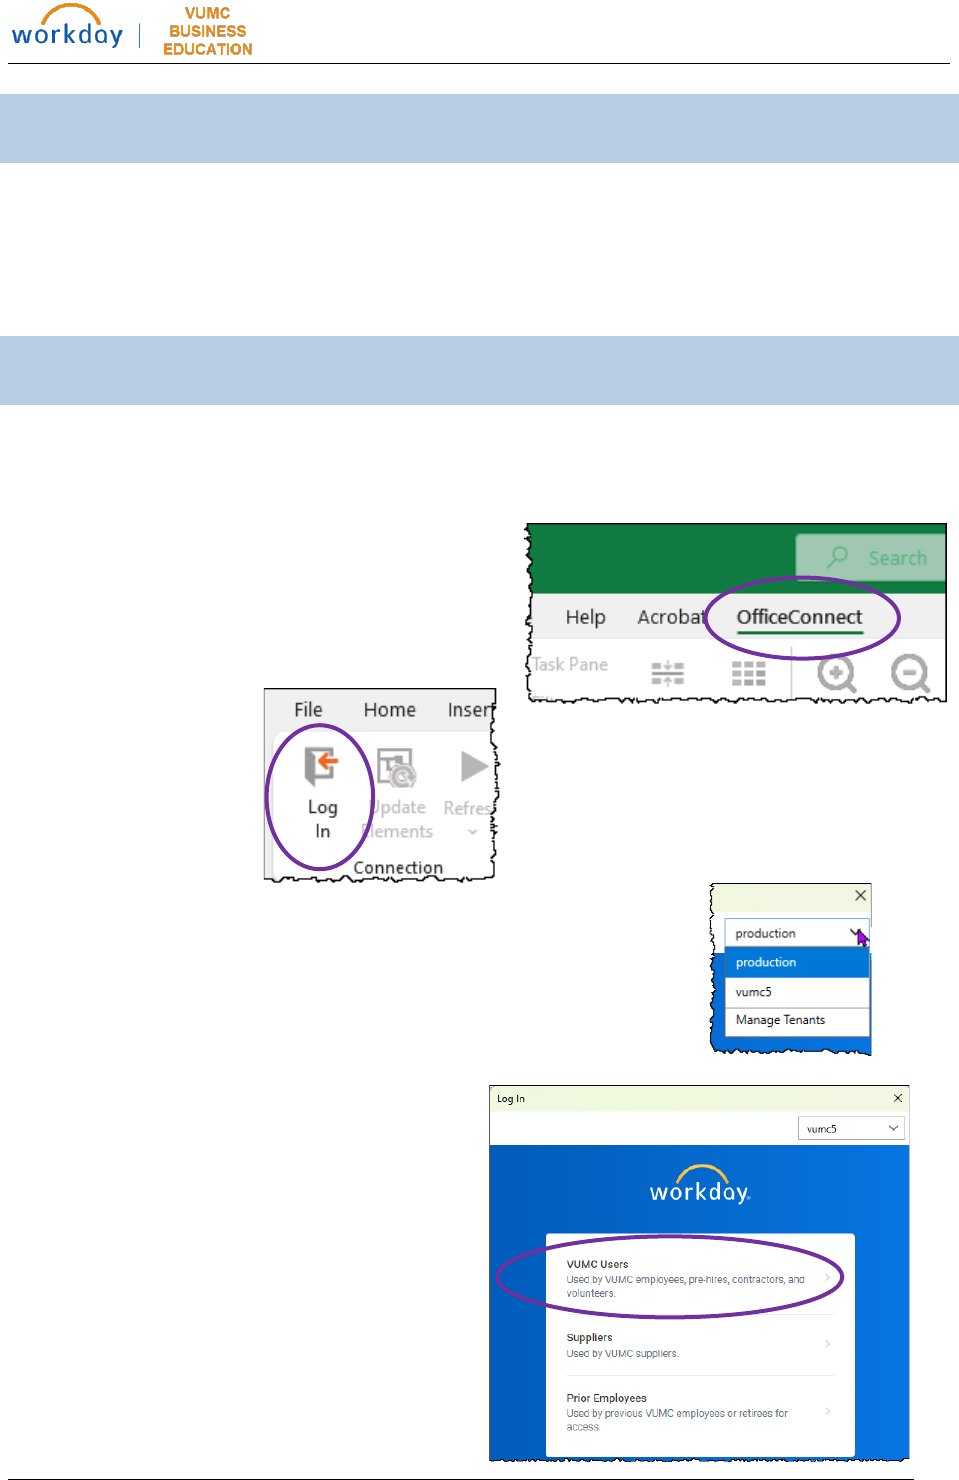
II. Accessing Office Connect
Office Connect is accessed from within Excel. Note: if you do not see Office Connect, see
Section VI: Reporting Tips and Limitations.
Steps:
1. Select the Office Connect Tab.
2. Click Log In.
3. Use the version drop-down menu to select the Workday or
Adaptive tenant you wish to access for reporting.
4. Login to Workday with the appropriate
credentials.
Office Connect for Financial Reports
2
Last Updated: 4/16/2024
III. Navigating Office Connect
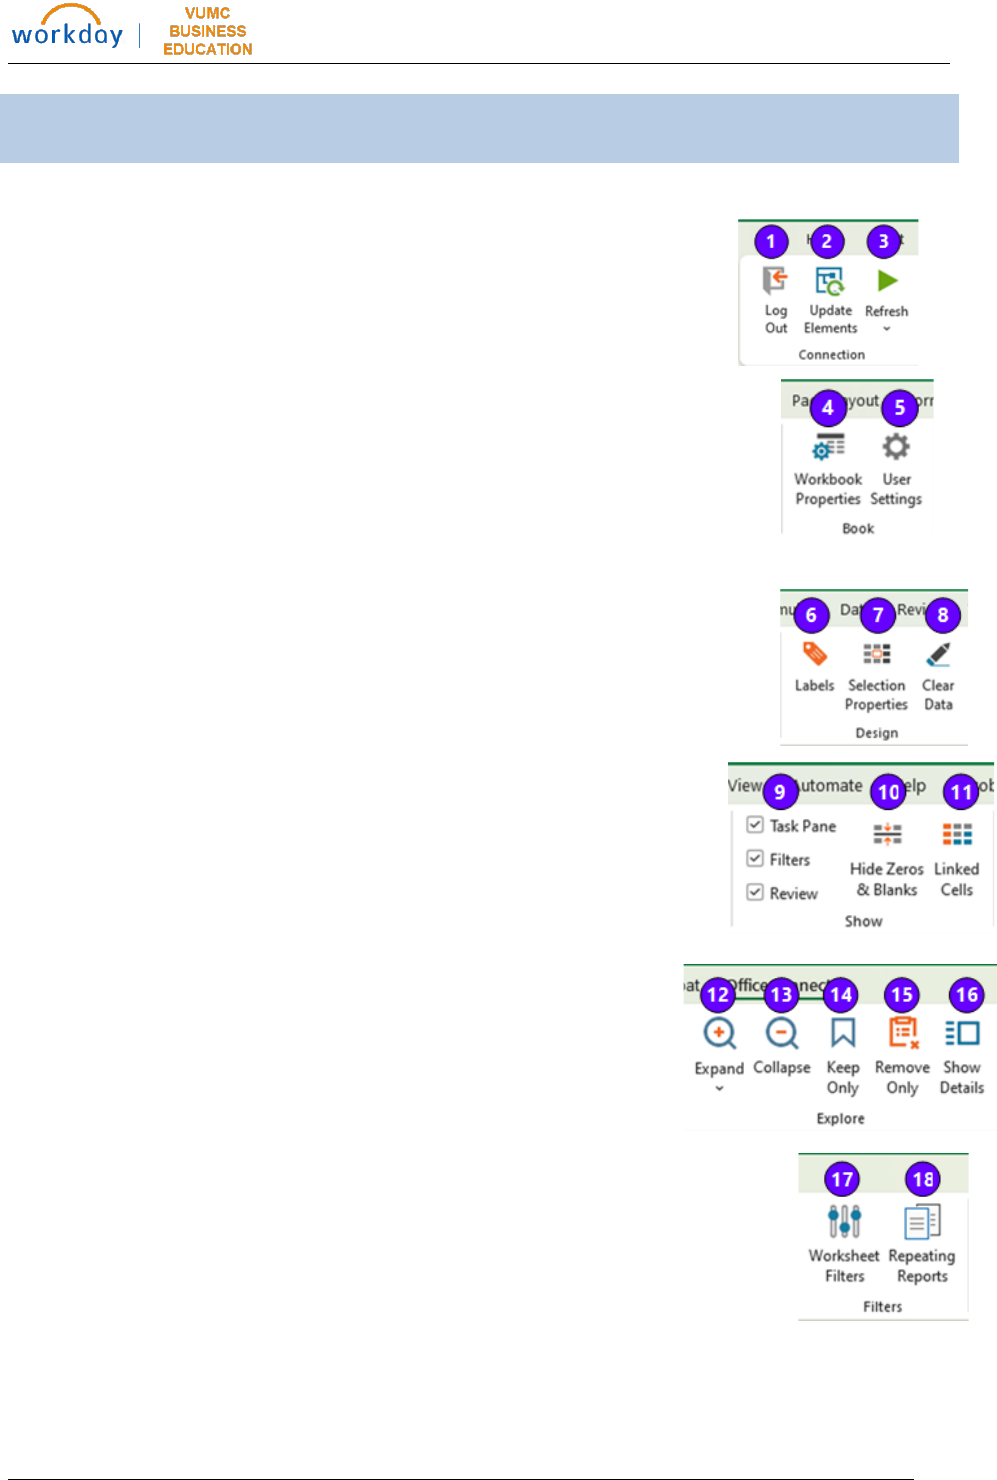
Office Connect Ribbon
1. Log Out: Click to Log out and disconnect from Office Connect.
2. Update Elements: Click to reload any changes to the elements from
Workday into Office Connect.
3. Refresh: Click to refresh your report with the current element data
loaded into Office Connect.
4. Workbook Properties: Click to open the Workbook Properties window.
Properties include date settings, clearing data when saving, filter
settings, rounding, and suppressing rows and/or columns with
zeros or no data.
5. User Settings: Click to open the User Settings window.
User settings include defaults such as rounding, showing zeros,
colors for labels, and default settings for expanding/collapsing rows
and/or columns.
6. Labels: click to apply custom, system, or element labels to your report.
7. Selection Properties: allows you to suppress rounding, or set what
shows or doesn’t show when values are zero or contain no data.
8. Clear Data: click to replace the data with the system default.
9. Check/uncheck boxes to display or hide features on the screen.
10. Hide Zeros & Blanks: Click to hide zeros and/or blanks in your
resulting report.
11. Linked Cells: Click to highlight data cells linked to Workday data
elements or labels.
12. Expand: Click to expand the element.
13. Collapse: Click to collapse the element.
14. Keep Only: Click to keep only the data selected.
15. Remove Only: Click to remove the data selected.
16. Show Details: Click to show the journal details of the data
selected in a separate tab.
17. Worksheet Filters: Select to apply filters to your report.
18. Repeating Reports: Similar to the Cascade Reports function
in Hyperion. It will allow you to display elements across
multiple sheets within a workbook.
Office Connect for Financial Reports
3
Last Updated: 4/16/2024
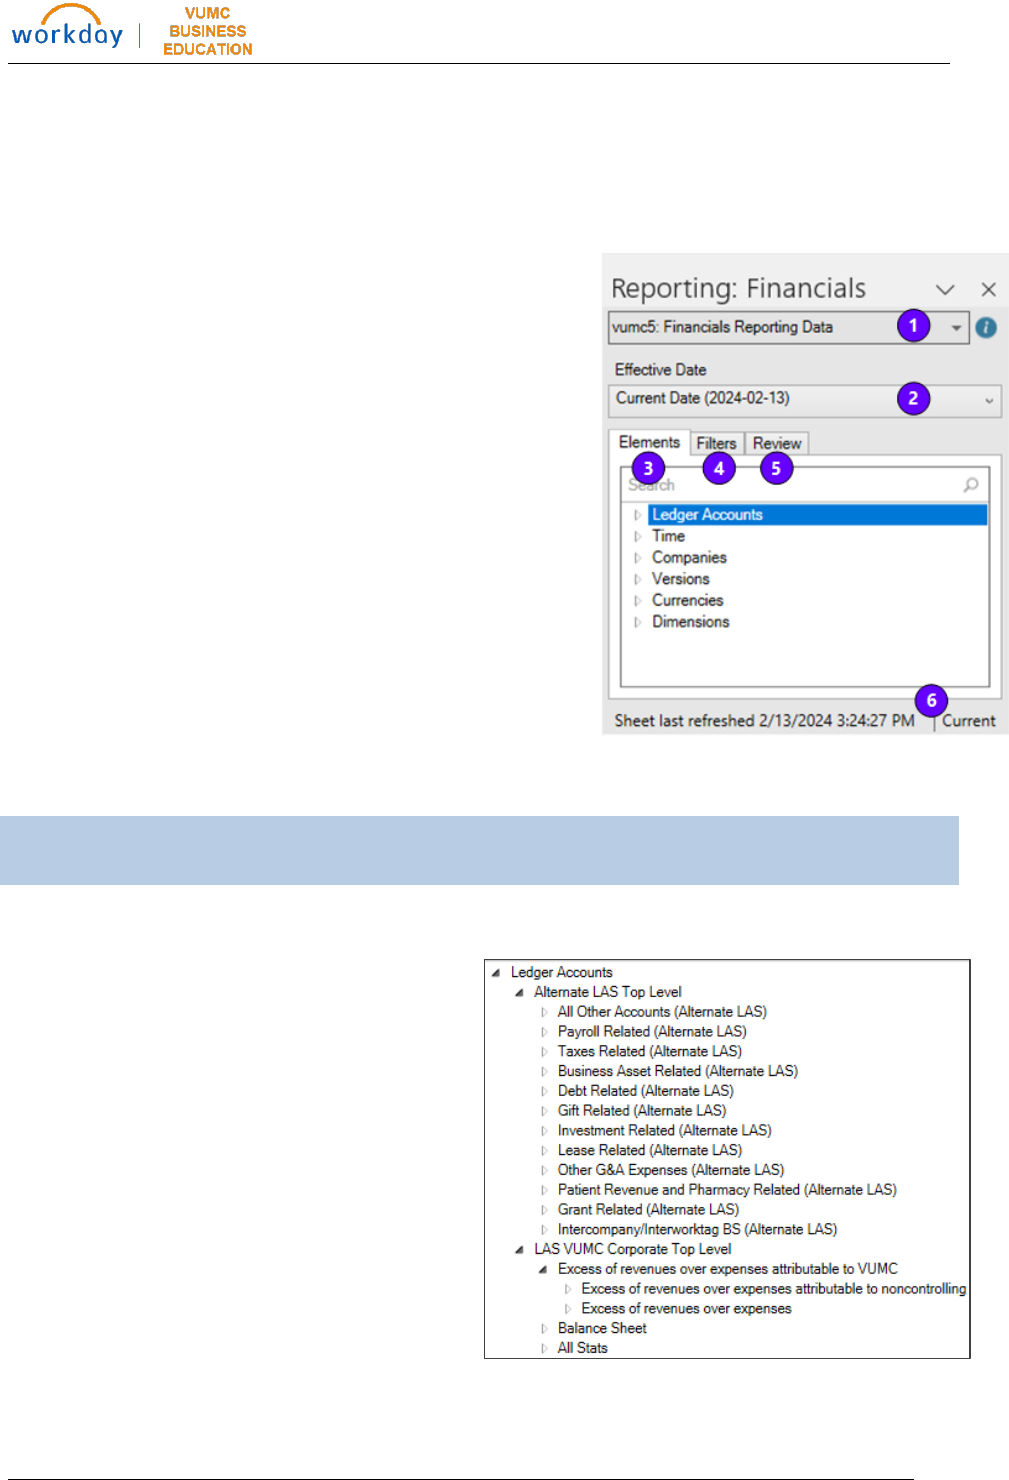
Task Pane
The task pane displays to the left of your sheet. It contains the elements used to build your
report in Office Connect. Once selected, it will also allow you to apply and view filters, and the
details of the data for each of the rows, columns, or cells containing elements and data.
1. The Workday tenant you are connected to displays.
2. The Effective Date defaults to the current date.
Use the drop-down menu to change the selection.
3. Use the Elements tab to add elements to your
sheet to build your report in Office Connect. See
Section IV. Report Elements below for more
information.
4. The Filters tab can be used to apply filters to your
report.
5. Use the Review tab to view the elements applied
to each column, row, or cell within your report.
6. The bottom of the task pane displays when the
data was last refreshed.
IV. Report Elements
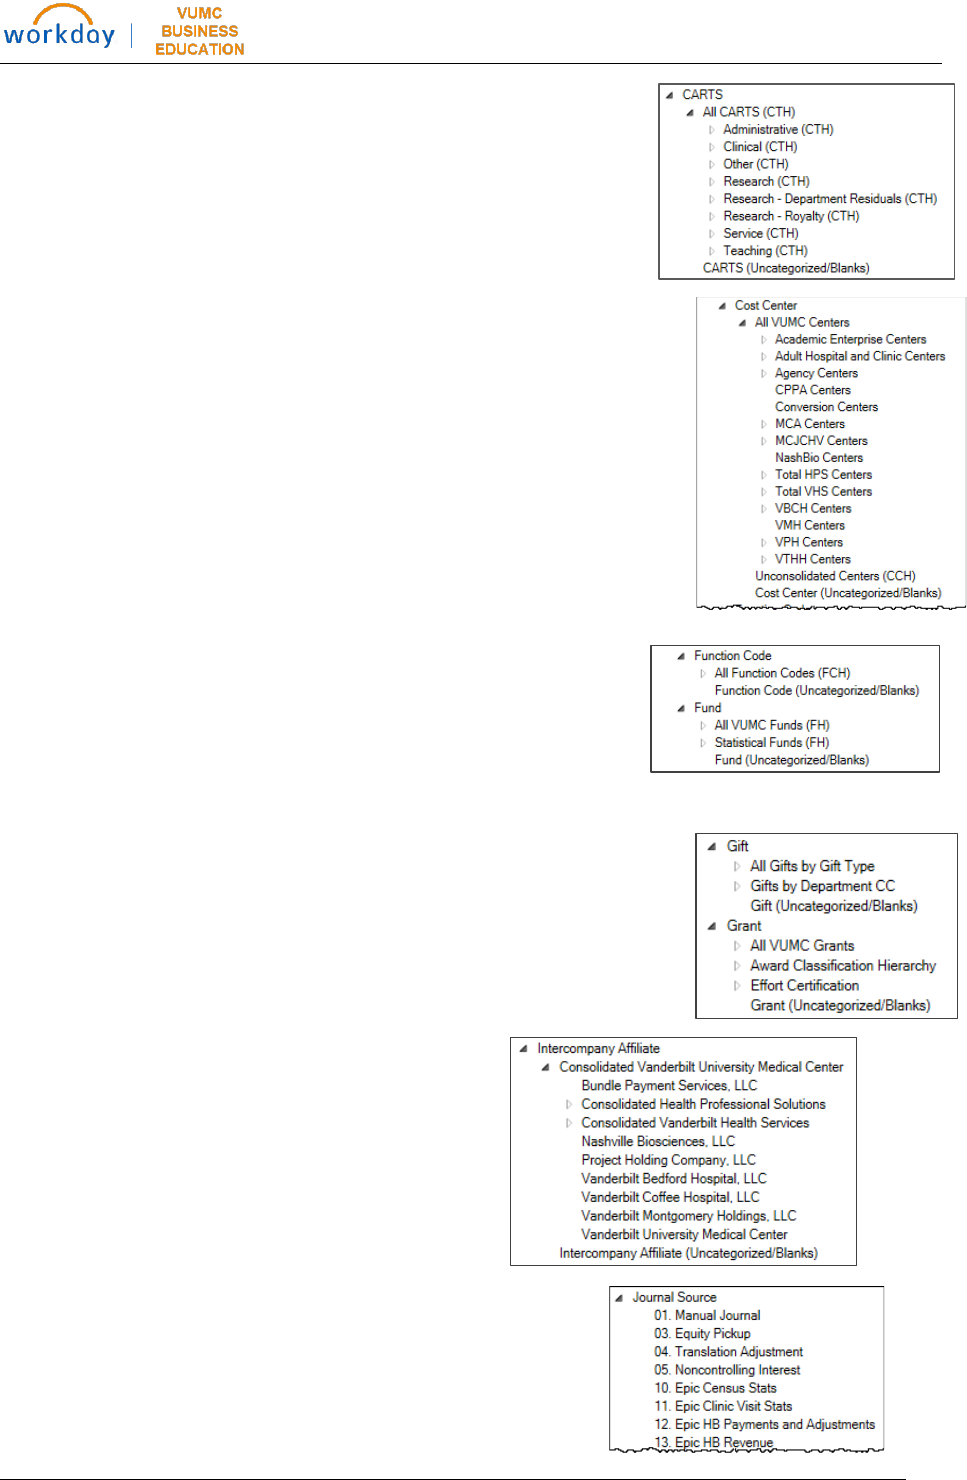
Ledger Accounts
Ledger Accounts elements include the
Alternate LAS Top Level rollups and the LAS
VUMC Corporate Top Level rollups.
Elements can be added at any level.
Office Connect for Financial Reports
4
Last Updated: 4/16/2024
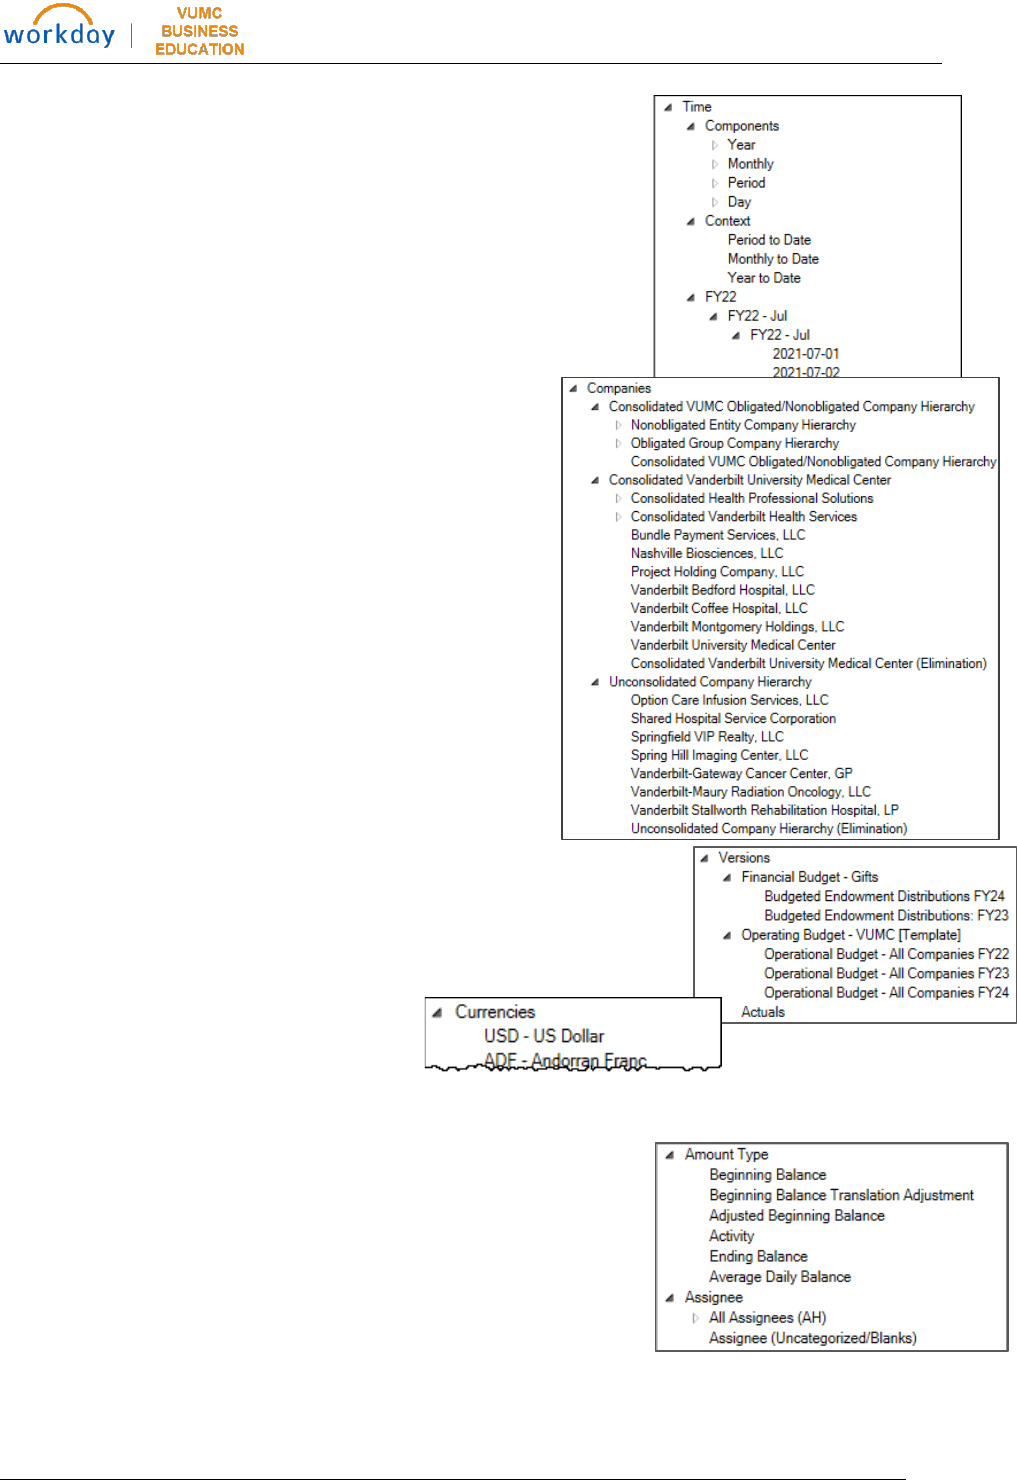
Time
The Time element includes Components (Year, Monthly, Period,
or Day), Context (Period to Date, Monthly to Date, or Year to
Date), and Fiscal Year. Note: Activity element must be set at
Activity to view Year-to-date context.
Companies
Company Hierarchies are included to be selected at the
hierarchy level or individual company level.
Versions
Versions include Financial Budget – Gifts distributions by fiscal
year, Operating Budget by fiscal year, or Actuals.
Currencies
Currencies default to USD – US Dollar.
Dimensions
Additional Dimensions can be added to your report, including
the following:
Amount Type: Include balances or activity. If not selected,
Ending Balance is the default. Note: must be set at Activity to
view Year-to-date Time context. Best practice is to set all P&L
reports at Activity.
Assignee: This element can be selected to limit results but is not
required.
Office Connect for Financial Reports
5
Last Updated: 4/16/2024
CARTS: This element can be selected to limit results but is not
required.
Cost Center: All VUMC Centers and rollups are included. If not
selected, All VUMC Centers is the default.
Function Code: this element can be selected to limit results but
is not required.
Fund: this element can be selected to limit results but is not
required.
Gift: All Gift worktags and hierarchies are included and available to
be selected.
Grant: All Grant worktags and hierarchies are included and available
to be selected.
Intercompany Affiliate: this element can be
selected to limit results but is not required.
Journal Source: A journal source can be selected to limit
results in the report but is not required.
Office Connect for Financial Reports
6
Last Updated: 4/16/2024
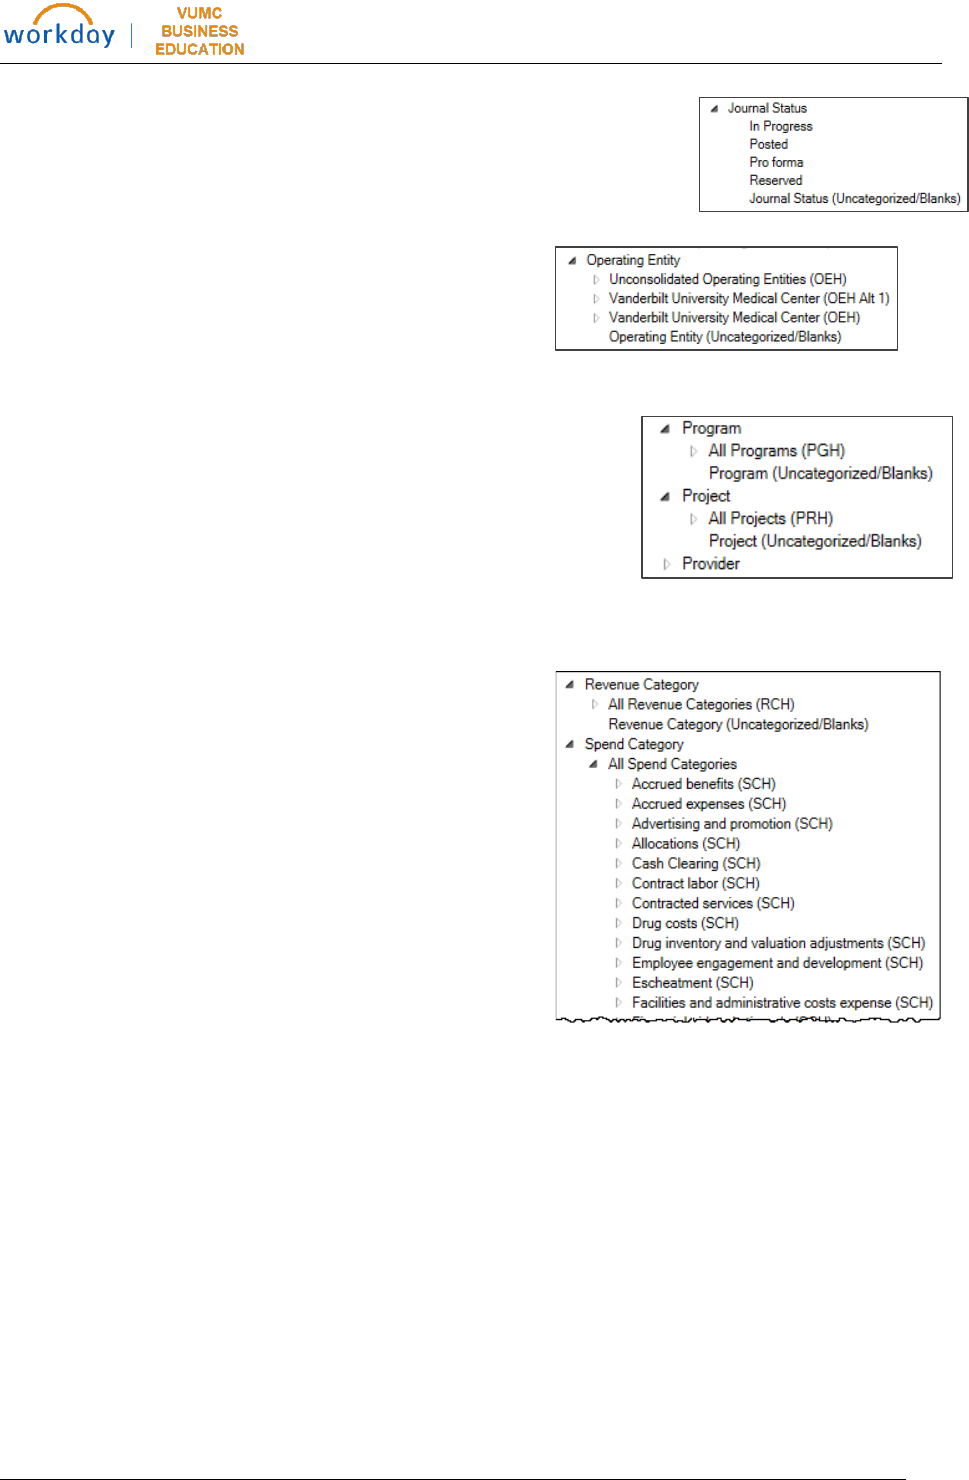
Journal Status: A journal status can be selected to limit results. If not
selected, the status will default to include Posted, Pro forma, and
Uncategorized/Blanks.
Operating Entity: Operating Entity is not required.
However, if selected, ensure that other elements align
within the Operating Entity selected.
Program: A Program worktag or hierarchy can be selected to
limit results in the report but is not required.
Project: A Project worktag or hierarchy can be selected to limit
results in the report but is not required.
Provider: A Provider worktag can be selected to limit results in
the report but is not required.
Revenue Category: Revenue Categories and rollups
are available to select and limit results displayed. If
not selected, all revenue categories will display based
on other elements (such as Ledger Account) selected.
Spend Category: Spend Categories and rollups are
available to select and limit results displayed. If not
selected, all spend categories will display based on
other elements (such as Ledger Account) selected.
Office Connect for Financial Reports
7
Last Updated: 4/16/2024
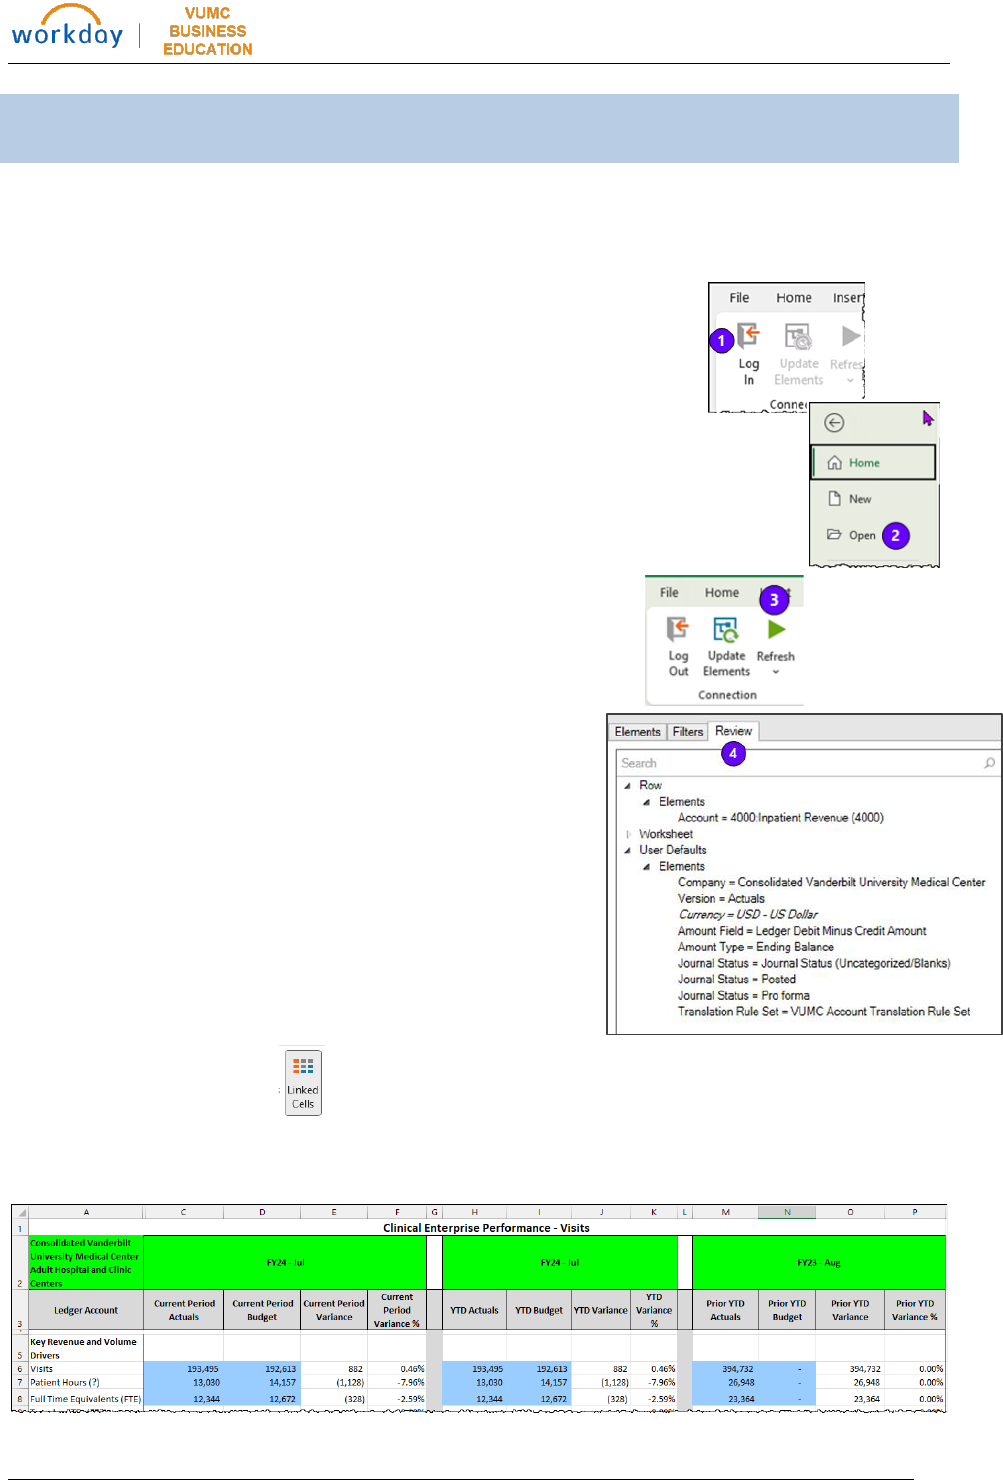
V. Refreshing a Report
Reports created using Office Connect can be opened and refreshed to display new or updated
data.
Steps:
1. Log in to Office Connect.
2. Open an Office Connect report. Note: if you are opening a Sharepoint
file, open the file in the App, and save a local copy before editing.
3. Click Refresh to update the data in the report.
4. Select any row, column, or cell and select the
Review tab on the task bar to view the elements
included in the results.
Use the Linked Cells button on the Office Connect ribbon to highlight the data elements
from Workday in blue and the data labels set in green. (all unhighlighted cells are manually
entered/formulas).
Office Connect for Financial Reports
8
Last Updated: 4/16/2024
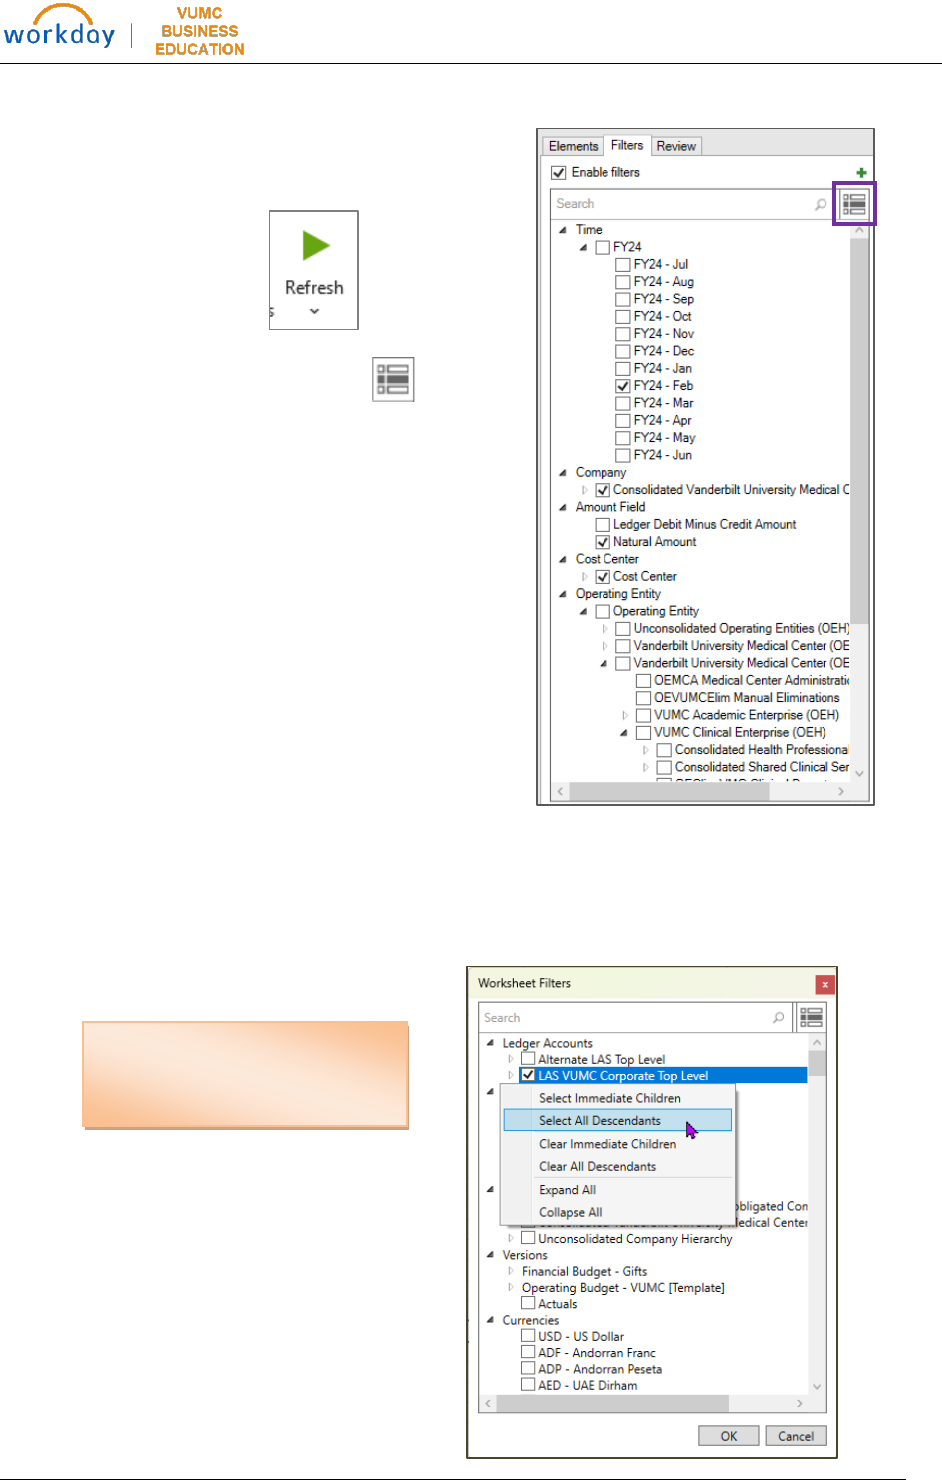
5. Click the Filters tab to change filters to the worksheet.
6. To apply the filters, click Refresh.
Use the Show Selected Filters button to display
selected filters.
Amount Field Filters:
Ledger Debit Minus Credit Amount – will display
the positive/negative amounts for traditional
accounting of debits and credits.
Natural Amount – will display positive amounts in
the report for both debits and credits.
Note: if Filters are not available, click the green + on the Filters tab to add filter selections.
Right-click to select Children
or All Descendants when
adding filters.
Office Connect for Financial Reports
9
Last Updated: 4/16/2024
VI. Ad-Hoc Reporting
With Office Connect, you can create your own ad-hoc reports that can be refreshed and
updated whenever needed.
Steps:
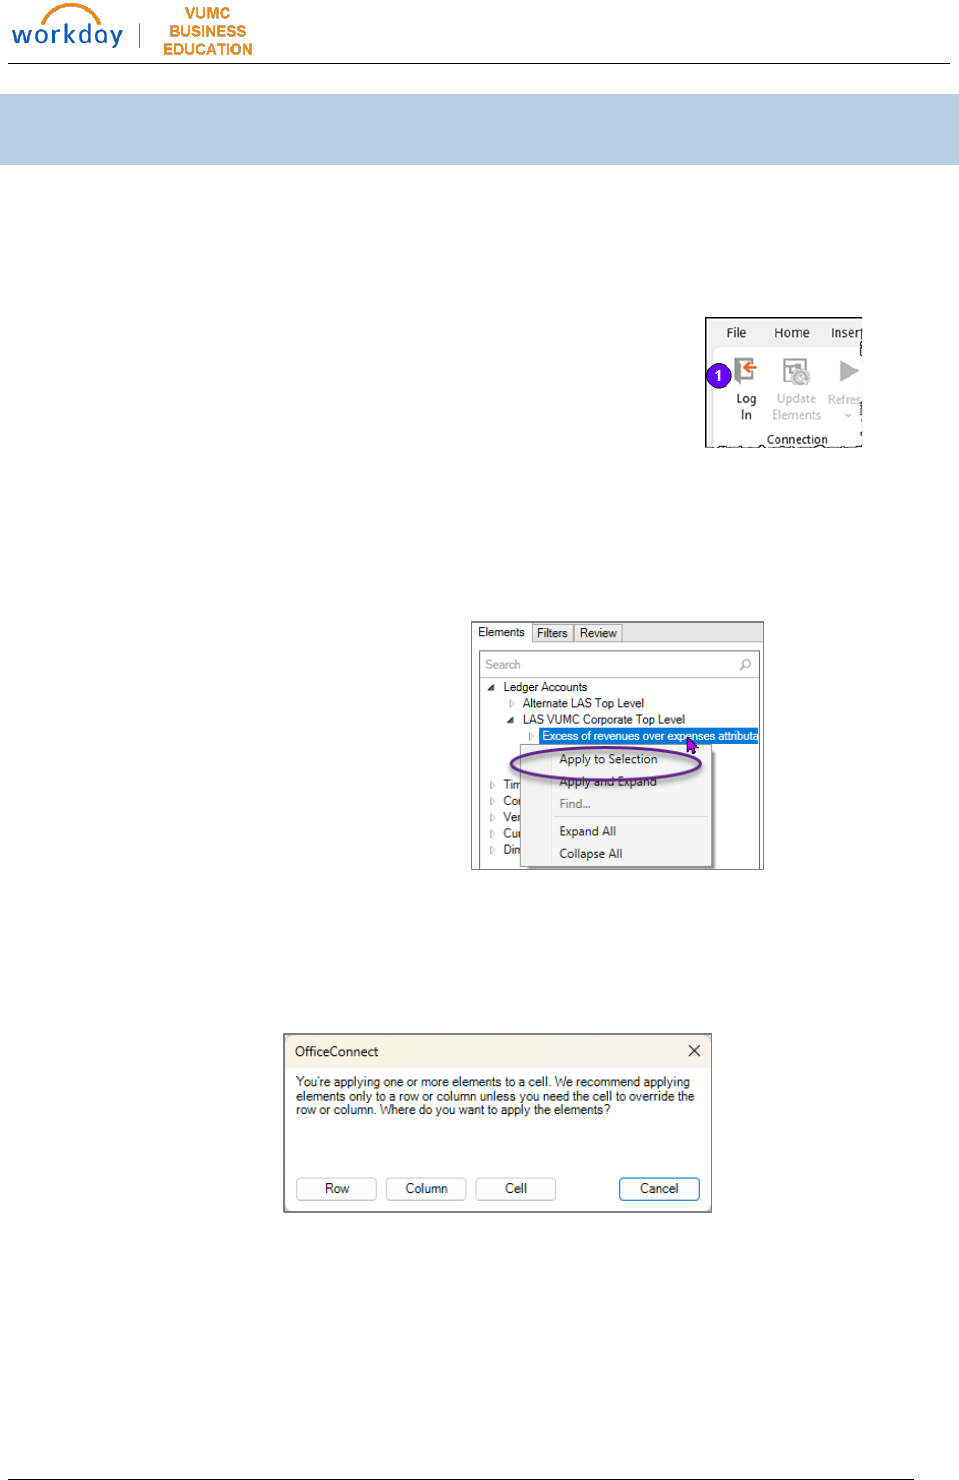
1. Log in to Office Connect.
2. Select an element within the Task Pane to add to an area of your spreadsheet. You can
do this by either:
a. Drag and drop the selection to the spreadsheet, or
b. Right click on the element and select Apply to Selection.
3. OfficeConnect will ask if you want to apply the element to the Row, the Column, or the
Cell. Make the appropriate selection for your report. Note if you select the entire row
or column before applying the selection, you will not see the selection window below.
Office Connect for Financial Reports
10
Last Updated: 4/16/2024
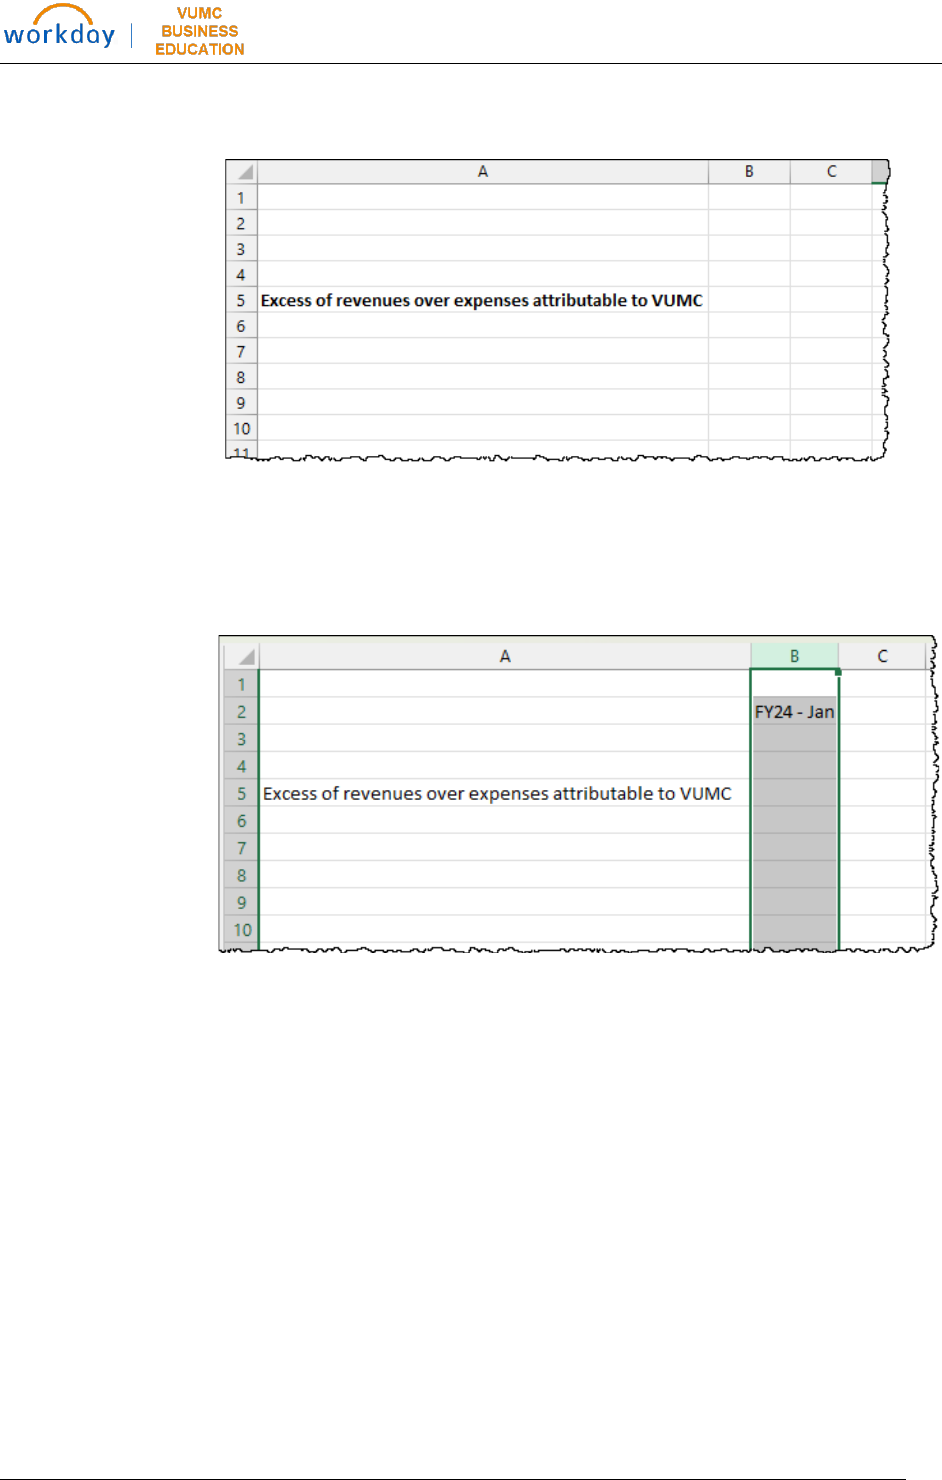
Note: In the example report below, the Ledger Account element was applied to Row 5.
4. Continue to add elements to the worksheet and build your report.
Note: In the example report below, the Time element of FY24-Jan was applied to Column B.

Office Connect for Financial Reports
11
Last Updated: 4/16/2024
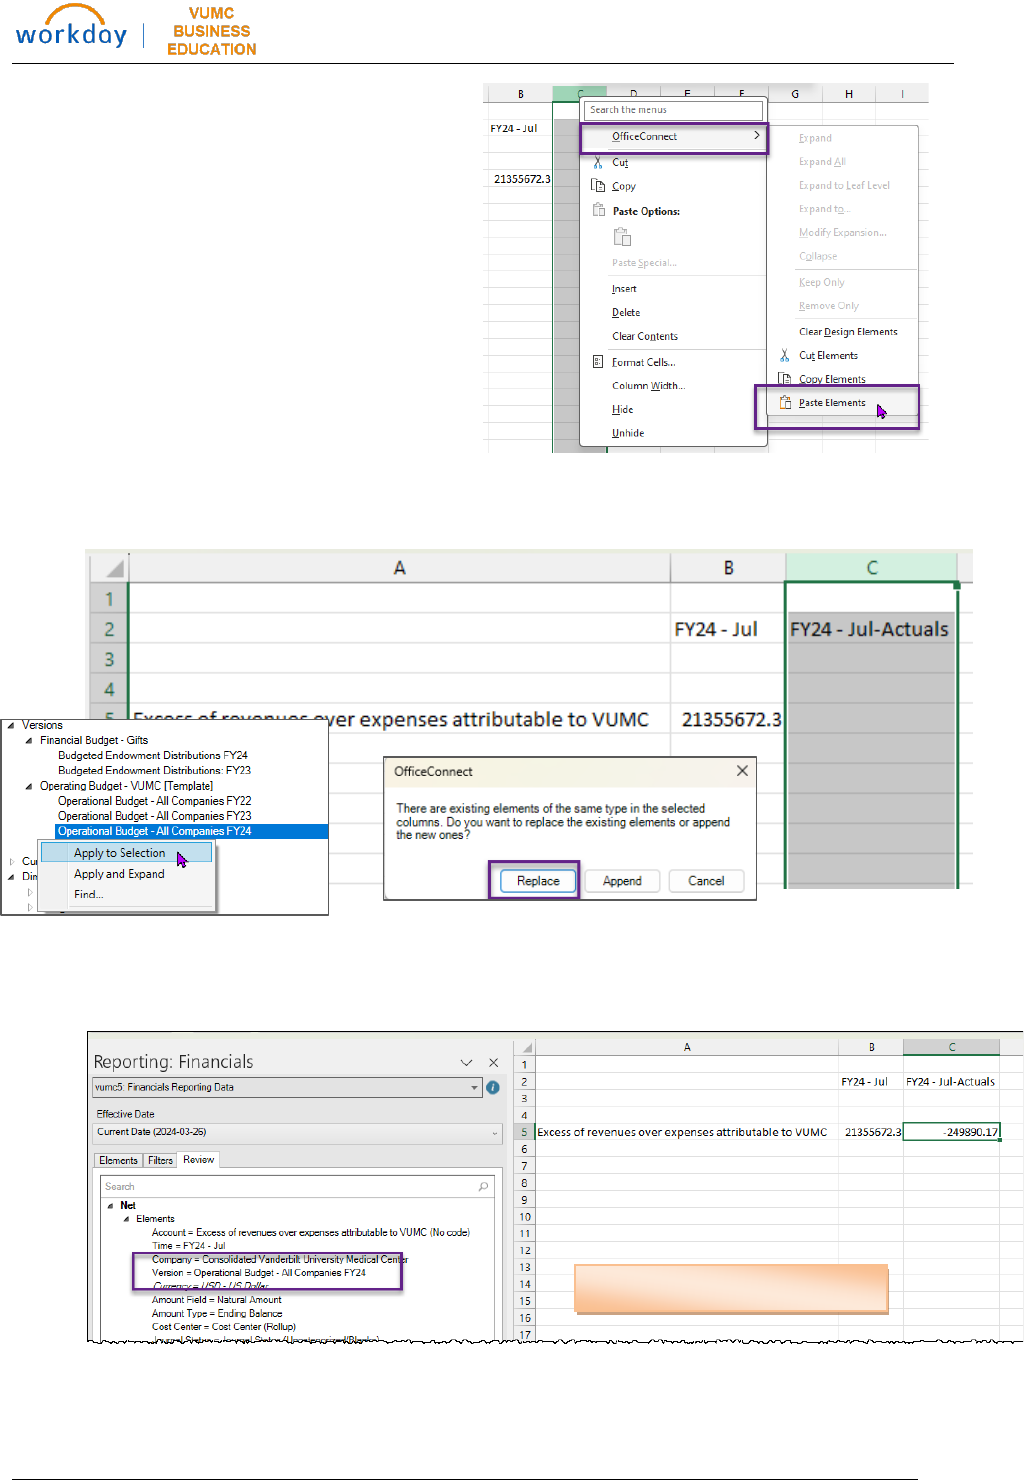
5. Select any cell of the spreadsheet and click the Review tab to view the elements applied
to that intersection/cell.
6. Click Refresh to update the data
for the element(s) added to your
report.
7. To quickly copy elements to additional
columns, right-click the column and select
OfficeConnect, Copy Elements.
Note: Using the Review tab will also
allow you to view any defaults for
included elements.
Office Connect for Financial Reports
12
Last Updated: 4/16/2024
8. In the new column, select
OfficeConnect, Paste Elements.
9. Update the elements in the new column by selecting the column, re-selecting the
elements, and choosing Replace.
10. Click Refresh.
Note: Labels will not update.
Office Connect for Financial Reports
13
Last Updated: 4/16/2024
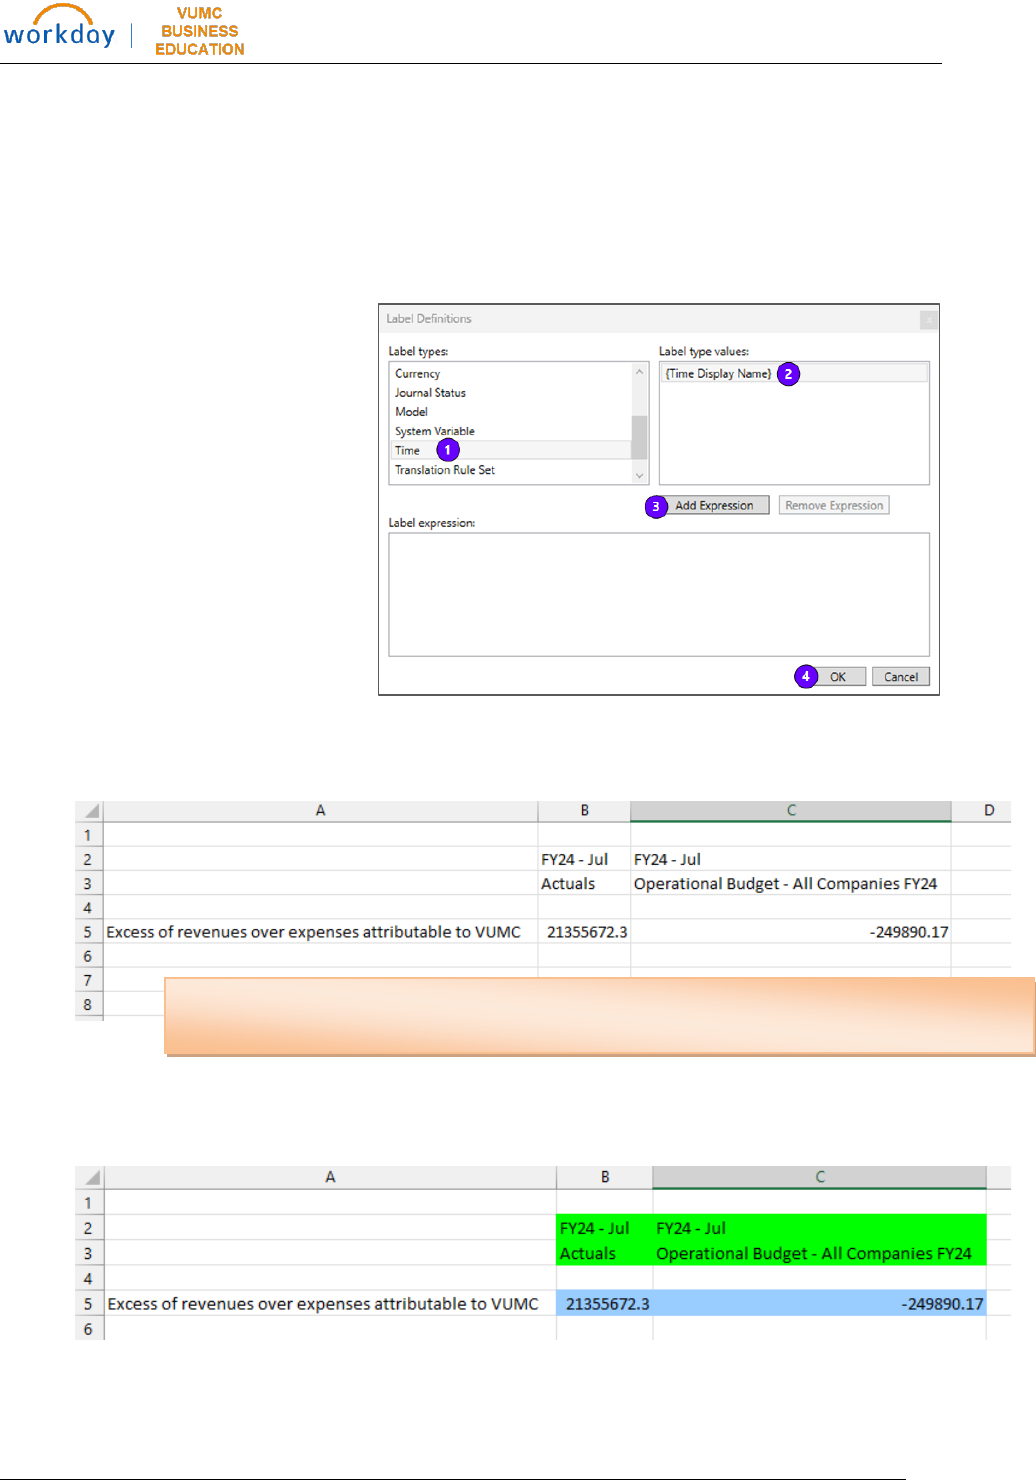
11. Add OfficeConnect Labels to your report.
In the example below:
• Select first label cells (B2 & C2) and click Labels
1. Select the Label type
2. Select the Label type value
3. Click Add Expression
4. Click OK
• Repeat for each Label row
• Click Refresh.
12. Click Linked Cells to highlight the data elements from Workday in blue and the data
labels set in green.
Note: In this example, a Time label was applied to B2 and C2 and a Version label was
applied to B3 and C3.
Office Connect for Financial Reports
14
Last Updated: 4/16/2024
VII. Reporting Tips and Limitations
Year-to-Date Time Context – To use the Year-to-Date time context (see Time element), the
Amount Type element must be set at Activity. Note that Balance sheet accounts should use
the Ending balance amount type with no time context.
Workbook Date – The workbook date can be set so that Time elements in your report can be
set to “relative” to the workbook date. Best practice is to set the workbook date first, then add
the elements and build your report. After the report is built, you can change the workbook
date to update the relative element dates. This should be used for rolling trend reports.
Intercompany Eliminations –
• For report prompts to use for intercompany eliminations, see Link to Report Prompts
• 2095: Interworktag Payable and 1394/1395: Interworktag Receivable are not
supported by OCF
• Workaround:
o Move payable manually up to the receivable line to net
o Amount field must be “Ledger Debit Minus Credit Amount” NOT “Natural
Amount”
Current Net Assets - Office Connect does not currently calculate Account 3000, Current Net
Assets, from the Income Statement. In order to display a balance for Account 3000 (in a
balance sheet report for example), the P&L account for Excess of Revenues over Expenses
Attributable to VUMC must be used in lieu of Account 3000.
Link to Pilot Reports - Pilot Reports
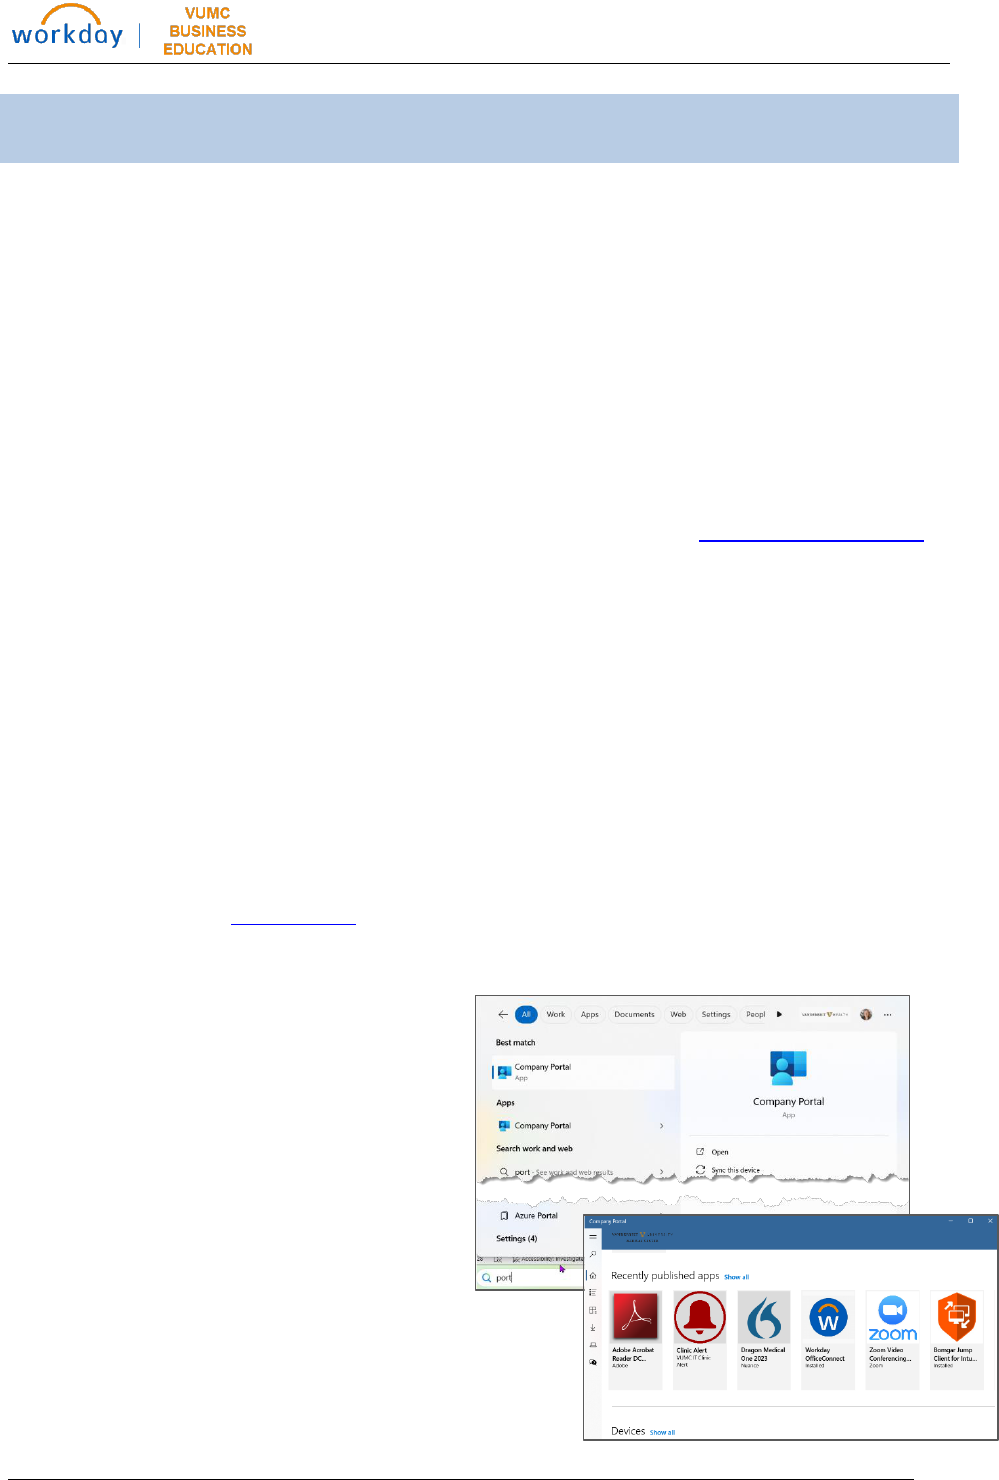
Download Office Connect – If OfficeConnect is not available in your version of Excel
• From your computer, open the
Company Portal App
• Find and install Workday Office
Connect
