METHOD 300.0
DETERMINATION OF INORGANIC ANIONS BY ION CHROMATOGRAPHY
John D. Pfaff
Inorganic Chemistry Branch
Chemistry Research Division
Revision 2.1
August 1993
ENVIRONMENTAL MONITORING SYSTEMS LABORATORY
OFFICE OF RESEARCH AND DEVELOPMENT
U.S. ENVIRONMENTAL PROTECTION AGENCY
CINCINNATI, OHIO 45268

METHOD 300.0
DETERMINATION OF INORGANIC ANIONS BY ION CHROMATOGRAPHY
1.0 SCOPE AND APPLICATION
1.1 This method covers the determination of the following inorganic anions:
PART A.
Bromide Nitrite
Chloride Ortho-Phosphate-P
Fluoride Sulfate
Nitrate
PART B.
Bromate Chlorite
Chlorate
1.2 The matrices applicable to each method are shown below:
1.2.1 Drinking water, surface water, mixed domestic and industrial
wastewaters, groundwater, reagent waters, solids (after extraction 11.7),
leachates (when no acetic acid is used).
1.2.2 Drinking water and reagent waters
1.3 The single laboratory Method Detection Limit (MDL defined in Section 3.2) for
the above analytes is listed in Tables 1A and 1B. The MDL for a specific
matrix may differ from those listed, depending upon the nature of the sample.
1.4 Method A is recommended for drinking and wastewaters. The multilaboratory
ranges tested for each anion are as follows:
Analyte
mg/L
Bromide 0.63 - 21.0
Chloride 0.78 - 26.0
Fluoride 0.26 - 8.49
Nitrate-N 0.42 - 14.0
Nitrite-N 0.36 - 12.0
Otho-Phosphate-P 0.69 - 23.1
Sulfate 2.85 - 95.0
1.5 This method is recommended for use only by or under the supervision of
analysts experienced in the use of ion chromatography and in the
interpretation of the resulting ion chromatograms.

1.6 When this method is used to analyze unfamiliar samples for any of the above
anions, anion identification should be supported by the use of a fortified
sample matrix covering the anions of interest. The fortification procedure is
described in Section 11.6.
1.7 Users of the method data should state the data-quality objectives prior to
analysis. Users of the method must demonstrate the ability to generate
acceptable results with this method, using the procedures described in
Section 9.0.
2.0 SUMMARY OF METHOD
2.1 A small volume of sample, typically 2-3 mL, is introduced into an ion
chromatograph. The anions of interest are separated and measured, using a
system comprised of a guard column, analytical column, suppressor device,
and conductivity detector.
2.2 The main differences between Parts A and B are the separator columns and
guard columns. Sections 6.0 and 7.0 will elicit the differences.
2.3 An extraction procedure must be performed to use this method for solids
(See Section 11.7).
2.4 Limited performance-based method modifications may be acceptable provided
they are fully documented and meet or exceed requirements expressed in
Section 9.0, Quality Control.
3.0 DEFINITIONS
3.1 Calibration Blank (CB) -- A volume of reagent water fortified with the same
matrix as the calibration standards, but without the analytes, internal
standards, or surrogate analytes.
3.2 Calibration Standard (CAL) -- A solution prepared from the primary dilution
standard solution or stock standard solutions and the internal standards and
surrogate analytes. The CAL solutions are used to calibrate the instrument
response with respect to analyte concentration.
3.3 Field Duplicates (FD) -- Two separate samples collected at the same time and
placed under identical circumstances and treated exactly the same throughout
field and laboratory procedures. Analyses of field duplicates indicate the
precision associated with sample collection, preservation and storage, as well
as with laboratory procedures.
3.4 Instrument Performance Check Solution (IPC) -- A solution of one or more
method analytes, surrogates, internal standards, or other test substances used
to evaluate the performance of the instrument system with respect to a defined
set of criteria.
3.5 Laboratory Fortified Blank (LFB) -- An aliquot of reagent water or other blank
matrices to which known quantities of the method analytes are added in the
laboratory. The LFB is analyzed exactly like a sample, and its purpose is to
determine whether the methodology is in control, and whether the laboratory
is capable of making accurate and precise measurements.
3.6 Laboratory Fortified Sample Matrix (LFM) -- An aliquot of an environmental
sample to which known quantities of the method analytes are added in the
laboratory. The LFM is analyzed exactly like a sample, and its purpose is to
determine whether the sample matrix contributes bias to the analytical results.
The background concentrations of the analytes in the sample matrix must be
determined in a separate aliquot and the measured values in the LFM
corrected for background concentrations.
3.7 Laboratory Reagent Blank (LRB) -- An aliquot of reagent water or other blank
matrices that are treated exactly as a sample including exposure to all
glassware, equipment, solvents, reagents, internal standards, and surrogates
that are used with other samples. The LRB is used to determine if method
analytes or other interferences are present in the laboratory environment, the
reagents, or the apparatus.
3.8 Linear Calibration Range (LCR) -- The concentration range over which the
instrument response is linear.
3.9 Material Safety Data Sheet (MSDS) -- Written information provided by
vendors concerning a chemical's toxicity, health hazards, physical properties,
fire, and reactivity data including storage, spill, and handling precautions.
3.10 Method Detection Limit (MDL) -- The minimum concentration of an analyte
that can be identified, measured and reported with 99% confidence that the
analyte concentration is greater than zero.
3.11 Performance Evaluation Sample (PE) -- A solution of method analytes
distributed by the Quality Assurance Research Division (QARD),
Environmental Monitoring Systems Laboratory (EMSL-Cincinnati), U. S.
Environmental Protection Agency, Cincinnati, Ohio, to multiple laboratories for
analysis. A volume of the solution is added to a known volume of reagent
water and analyzed with procedures used for samples. Results of analyses are
used by QARD to determine statistically the accuracy and precision that can be
expected when a method is performed by a competent analyst. Analyte true
values are unknown to the analyst.
3.12 Quality Control Sample (QCS) -- A solution of method analytes of known
concentrations that is used to fortify an aliquot of LRB or sample matrix. The
QCS is obtained from a source external to the laboratory and different from
the source of calibration standards. It is used to check laboratory performance
with externally prepared test materials.

3.13 Stock Standard Solution (SSS) -- A concentrated solution containing one or
more method analytes prepared in the laboratory using assayed reference
materials or purchased from a reputable commercial source.
4.0 INTERFERENCES
4.1 Interferences can be caused by substances with retention times that are similar
to and overlap those of the anion of interest. Large amounts of an anion can
interfere with the peak resolution of an adjacent anion. Sample dilution
and/or fortification can be used to solve most interference problems associated
with retention times.
4.2 The water dip or negative peak that elutes near, and can interfere with, the
fluoride peak can usually be eliminated by the addition of the equivalent of 1
mL of concentrated eluent (7.3 100X) to l00 mL of each standard and sample.
4.3 Method interferences may be caused by contaminants in the reagent water,
reagents, glassware, and other sample processing apparatus that lead to
discrete artifacts or elevated baseline in ion chromatograms.
4.4 Samples that contain particles larger than 0.45 microns and reagent solutions
that contain particles larger than 0.20 microns require filtration to prevent
damage to instrument columns and flow systems.
4.5 Any anion that is not retained by the column or only slightly retained will
elute in the area of fluoride and interfere. Known coelution is caused by
carbonate and other small organic anions. At concentrations of fluoride above
1.5 mg/L, this interference may not be significant, however, it is the
responsibility of the user to generate precision and accuracy information in
each sample matrix.
4.6 The acetate anion elutes early during the chromatographic run. The retention
times of the anions also seem to differ when large amounts of acetate are
present. Therefore, this method is not recommended for leachates of solid
samples when acetic acid is used for pH adjustment.
4.7 The quantitation of unretained peaks should be avoided, such as low
molecular weight organic acids (formate, acetate, propionate etc.) which are
conductive and coelute with or near fluoride and would bias the fluoride
quantitation in some drinking and most waste waters.
4.8 Any residual chlorine dioxide present in the sample will result in the
formation of additional chlorite prior to analysis. If any concentration of
chlorine dioxide is suspected in the sample purge the sample with an inert gas
(argon or nitrogen) for about five minutes or until no chlorine dioxide remains.
5.0 SAFETY

5.1 The toxicity or carcinogenicity of each reagent used in this method have not
been fully established. Each chemical should be regarded as a potential health
hazard and exposure should be as low as reasonably achievable. Cautions are
included for known extremely hazardous materials or procedures.
5.2 Each laboratory is responsible for maintaining a current awareness file of
OSHA regulations regarding the safe handling of the chemicals specified in
this method. A reference file of Material Safety Data Sheets (MSDS) should be
made available to all personnel involved in the chemical analysis. The
preparation of a formal safety plan is also advisable.
5.3 The following chemicals have the potential to be highly toxic or hazardous,
consult MSDS.
5.3.1 Sulfuric acid (Section 7.4)
6.0 EQUIPMENT AND SUPPLIES
6.1 Balance -- Analytical, capable of accurately weighing to the nearest 0.000l g.
6.2 Ion chromatograph -- Analytical system complete with ion chromatograph and
all required accessories including syringes, analytical columns, compressed
gasses and detectors.
6.2.1 Anion guard column: A protector of the separator column. If omitted
from the system the retention times will be shorter. Usually packed
with a substrate the same as that in the separator column.
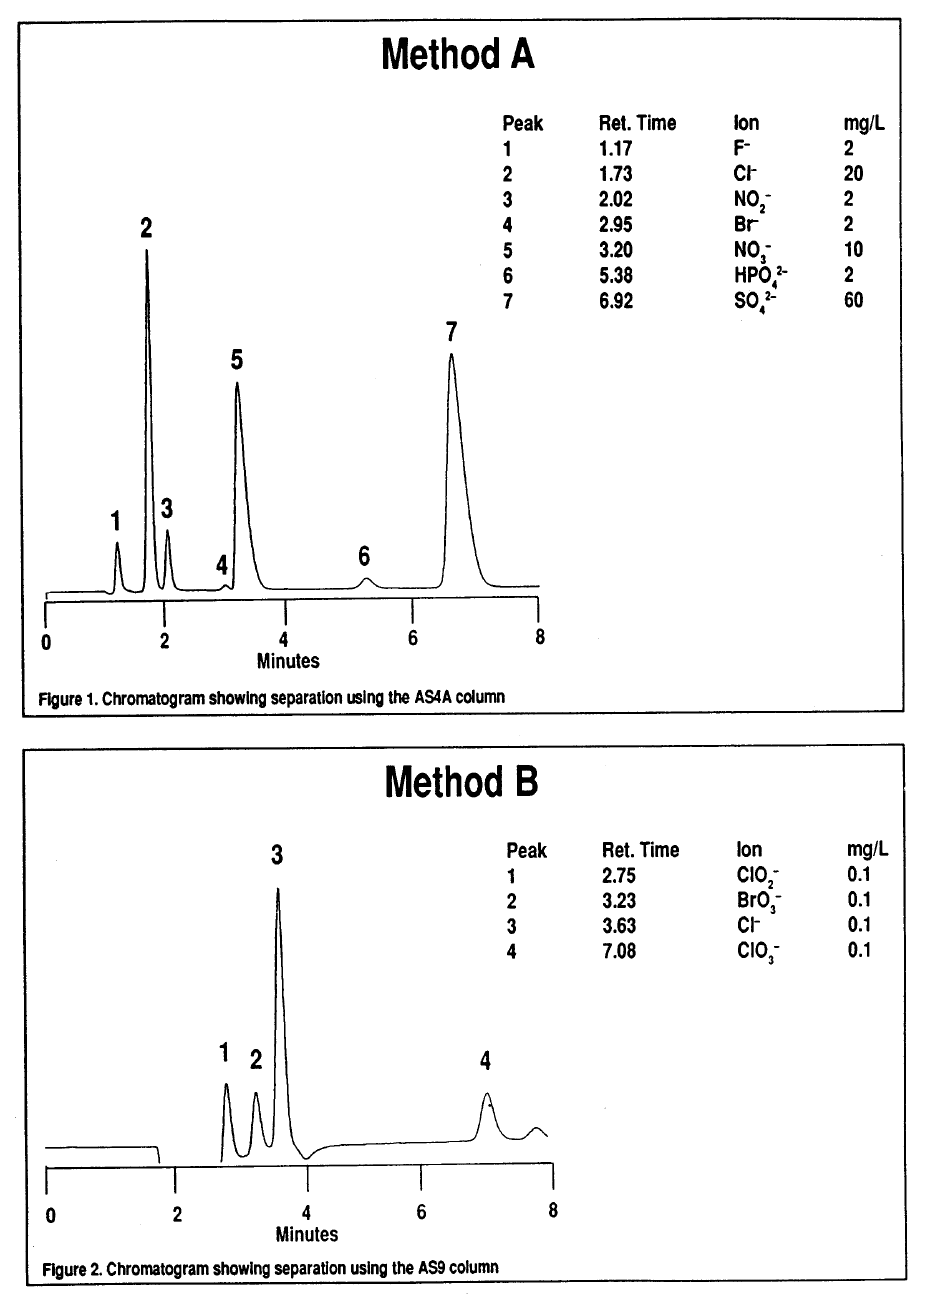
6.2.2 Anion separator column: This column produces the separation shown
in Figures 1 and 2.
6.2.2.1 Anion analytical column (Method A): The separation shown in Figure
1 was generated using a Dionex AS4A column (P/N 37041). An
optional column may be used if comparable resolution of peaks is
obtained, and the requirements of Section 9.2 can be met.
6.2.2.2 Anion analytical column (Method B): The separation shown in Figure 2
was generated using a Dionex AS9 column (P/N 42025). An optional
column may be used if comparable resolution of peaks is obtained and
the requirements of Section 9.2 can be met.
6.2.3 Anion suppressor device: The data presented in this method were
generated using a Dionex anion micro membrane suppressor
(P/N 37106).
6.2.4 Detector -- Conductivity cell: Approximately 1.25 µL internal volume,
(Dionex, or equivalent) capable of providing data as required in
Section 9.2.

6.3 The Dionex AI-450 Data Chromatography Software was used to generate all
the data in the attached tables. Systems using a stripchart recorder and
integrator or other computer based data system may achieve approximately
the same MDL's but the user should demonstrate this by the procedure
outlined in Section 9.2.
7.0 REAGENTS AND STANDARDS
7.1 Sample bottles: Glass or polyethylene of sufficient volume to allow replicate
analyses of anions of interest.
7.2 Reagent water: Distilled or deionized water, free of the anions of interest.
Water should contain particles no larger than 0.20 microns.
7.3 Eluent solution (Method A and Method B): Sodium bicarbonate
(CASRN 144-55-8) 1.7 mM, sodium carbonate (CASRN 497-19-8) 1.8 mM.
Dissolve 0.2856 g sodium bicarbonate (NaHCO ) and 0.3816 g of sodium
3
carbonate (Na CO ) in reagent water (Section 7.2) and dilute to 2 L.
2 3
7.4 Regeneration solution (micro membrane suppressor): Sulfuric acid
(CASRN-7664-93-9) 0.025N. Dilute 2.8 mL conc. sulfuric acid (H SO ) to 4 L
2 4
with reagent water.
7.5 Stock standard solutions, l000 mg/L (1 mg/mL): Stock standard solutions
may be purchased as certified solutions or prepared from ACS reagent grade
materials (dried at 105°C for 30 minutes) as listed below.
-
7.5.1 Bromide (Br ) 1000 mg/L: Dissolve 1.2876 g sodium bromide (NaBr,
CASRN 7647-15-6) in reagent water and dilute to 1 L.
-
7.5.2 Bromate (BrO ) 1000 mg/L: Dissolve 1.1798g of sodium bromate
3
(NaBrO , CASRN 7789-38-0) in reagent water and dilute to 1 L.
3
-
7.5.3 Chlorate (Cl0 ) 1000 mg/L: Dissolve 1.2753g of sodium chlorate
3
(NaC10 , CASRN 7775-09-9) in reagent water and dilute to 1 L.
3
-
7.5.4 Chloride (Cl ) l000 mg/L: Dissolve 1.6485 g sodium chloride (NaCl,
CASRN 7647-l4-5) in reagent water and dilute to 1 L.
-
7.5.5 Chlorite (Cl0 ) 1000 mg/L: Dissolve 1.3410g of sodium chlorite
2
(NaC10 , CASRN 7758-19-2) in reagent water and dilute to 1 L.
2
-
7.5.6 Fluoride (F ) 1000 mg/L: Dissolve 2.2100g sodium fluoride (NaF,
CASRN 7681-49-4) in reagent water and dilute to 1 L.
-
7.5.7 Nitrate (NO -N) 1000 mg/L: Dissolve 6.0679 g sodium nitrate (NaNO ,
3 3
CASRN 7631-99-4) in reagent water and dilute to 1 L.
-
7.5.8 Nitrite (NO -N) 1000 mg/L: Dissolve 4.9257 g sodium nitrite (NaNO ,
2 2
CASRN 7632-00-0) in reagent water and dilute to 1 L.

7.5.9 Phosphate (PO
=
4
-P) 1000 mg/L: Dissolve 4.3937 g potassium phosphate
(KH
2
PO
4
, CASRN 7778-77-0) in reagent water and dilute to 1 L.
7.5.10 Sulfate (SO
=
4
) 1000 mg/L: Dissolve 1.8141 g potassium sulfate (K
2
SO
4
,
CASRN 7778-80-5) in reagent water and dilute to 1 L.
Note: Stability of standards: Stock standards (7.5) are stable for at
least one month when stored at 4°C. Except for the chlorite standard
which is only stable for two weeks. Dilute working standards should
be prepared weekly, except those that contain nitrite and phosphate
should be prepared fresh daily.
7.6 Ethylenediamine preservation solution: Dilute 10 mL of ethylenediamine (99%)
(CASRN 107-15-3) to 200 mL with reagent water.
Use 1 mL of this dilution to
each 1 L of sample taken.
8.0 SAMPLE COLLECTION, PRESERVATION AND STORAGE
8.1 Samples should be collected in plastic or glass bottles. All bottles must be
thoroughly cleaned and rinsed with reagent water. Volume collected should
be sufficient to insure a representative sample, allow for replicate analysis, if
required, and minimize waste disposal.
8.2 Sample preservation and holding times for the anions that can be determined
by this method are as follows:
Analyte
Preservation Holding Time
Bromate None required 28 days
Bromide None required 28 days
Chlorate None required 28 days
Chloride None required 28 days
Chlorite Cool to 4°C immediately
Fluoride None required 28 days
Nitrate-N Cool to 4°C 48 hours
Combined conc. H SO
2 4
28 days
(Nitrate/Nitrite) to a pH <2
Nitrite-N Cool to 4°C 48 hours
0-Phosphate-P Cool to 4°C 48 hours
Sulfate Cool to 4°C 28 days
Note: If the determined value for the combined nitrate/nitrite exceeds
-
0.5 mg/L as N , a resample must be analyzed for the individual concentrations
of nitrate and nitrite.
8.3 The method of preservation and the holding time for samples analyzed by this
method are determined by the anions of interest. In a given sample, the anion
that requires the most preservation treatment and the shortest holding time
will determine the preservation treatment. It is recommended that all samples

be cooled to 4°C and held for no longer than 28 days for Method A and
analyzed immediately in Method B.
Note: If the sample cannot be analyzed for chlorite within ≤10 minutes, the
sample may be preserved by adding 1 mL of the ethylenediamine (EDA)
preservation solution (Section 7.6) to 1 L of sample. This will preserve the
concentration of the chlorite for up to 14 days. This addition of EDA has no
effect on bromate or chlorate, so they can also be determined in a sample
preserved with EDA. Residual chlorine dioxide should be removed from the
sample (per Section 4.8) prior to the addition of EDA.
9.0 QUALITY CONTROL
9.1 Each laboratory using this method is required to operate a formal quality
control (QC) program. The minimum requirements of this program consist of
an initial demonstration of laboratory capability, and the periodic analysis of
laboratory reagent blanks, fortified blanks and other laboratory solutions as a
continuing check on performance. The laboratory is required to maintain
performance records that define the quality of the data that are generated.
9.2 INITIAL DEMONSTRATION OF PERFORMANCE
9.2.1 The initial demonstration of performance is used to characterize
instrument performance (determination of LCRs and analysis of QCS)
and laboratory performance (determination of MDLs) prior to
performing analyses by this method.
9.2.2 Linear Calibration Range (LCR) -- The LCR must be determined
initially and verified every six months or whenever a significant change
in instrument response is observed or expected. The initial
demonstration of linearity must use sufficient standards to insure that
the resulting curve is linear. The verification of linearity must use a
minimum of a blank and three standards. If any verification data
exceeds the initial values by ±10%, linearity must be reestablished. If
any portion of the range is shown to be nonlinear, sufficient standards
must be used to clearly define the nonlinear portion.
9.2.3 Quality Control Sample (QCS) -- When beginning the use of this
method, on a quarterly basis or as required to meet data-quality needs,
verify the calibration standards and acceptable instrument performance
with the preparation and analyses of a QCS. If the determined
concentrations are not within ±10% of the stated values, performance of
the determinative step of the method is unacceptable. The source of
the problem must be identified and corrected before either proceeding
with the initial determination of MDLs or continuing with on-going
analyses.
9.2.4 Method Detection Limit (MDL) -- MDLs must be established for all
analytes, using reagent water (blank) fortified at a concentration of two

(6)
to three times the estimated instrument detection limit. To determine
MDL values, take seven replicate aliquots of the fortified reagent water
and process through the entire analytical method. Perform all
calculations defined in the method and report the concentration values
in the appropriate units. Calculate the MDL as follows:
where, t = Student's t value for a 99% confidence level
and a standard deviation estimate with n-1
degrees of freedom [t= 3.14 for seven replicates]
S = standard deviation of the replicate analyses
MDLs should be determined every six months, when a new operator
begins work or whenever there is a significant change in the
background or instrument response.
9.3 ASSESSING LABORATORY PERFORMANCE
9.3.1 Laboratory Reagent Blank (LRB) -- The laboratory must analyze at least
one LRB with each batch of samples. Data produced are used to assess
contamination from the laboratory environment. Values that exceed the
MDL indicate laboratory or reagent contamination should be suspected
and corrective actions must be taken before continuing the analysis.
9.3.2 Laboratory Fortified Blank (LFB) -- The laboratory must analyze at least
one LFB with each batch of samples. Calculate accuracy as percent
recovery (Section 9.4.2). If the recovery of any analyte falls outside the
required control limits of 90-110%, that analyte is judged out of control,
and the source of the problem should be identified and resolved before
continuing analyses.
9.3.3 The laboratory must use LFB analyses data to assess laboratory
performance against the required control limits of 90-110%. When
sufficient internal performance data become available (usually a
minimum of 20-30 analyses), optional control limits can be developed
from the percent mean recovery (x) and the standard deviation (S) of
the mean recovery. These data can be used to establish the upper and
lower control limits as follows:
UPPER CONTROL LIMIT = x + 3S
LOWER CONTROL LIMIT = x - 3S
The optional control limits must be equal to or better than the required
control limits of 90-110%. After each five to 10 new recovery
measurements, new control limits can be calculated using only the most
recent 20-30 data points. Also, the standard deviation (S) data should
be used to establish an on-going precision statement for the level of
concentrations included in the LFB. These data must be kept on file
and be available for review.
9.3.4 Instrument Performance Check Solution (IPC) -- For all determinations
the laboratory must analyze the IPC (a mid-range check standard) and
a calibration blank immediately following daily calibration, after every
tenth sample (or more frequently, if required) and at the end of the
sample run. Analysis of the IPC solution and calibration blank
immediately following calibration must verify that the instrument is
within ±10% of calibration. Subsequent analyses of the IPC solution
must verify the calibration is still within ±10%. If the calibration cannot
be verified within the specified limits, reanalyze the IPC solution. If the
second analysis of the IPC solution confirms calibration to be outside
the limits, sample analysis must be discontinued, the cause determined
and/or in the case of drift, the instrument recalibrated. All samples
following the last acceptable IPC solution must be reanalyzed. The
analysis data of the calibration blank and IPC solution must be kept on
file with the sample analyses data.
9.4 ASSESSING ANALYTE RECOVERY AND DATA QUALITY
9.4.1 Laboratory Fortified Sample Matrix (LFM) -- The laboratory must add a
known amount of analyte to a minimum of 10% of the routine samples.
In each case the LFM aliquot must be a duplicate of the aliquot used
for sample analysis. The analyte concentration must be high enough to
be detected above the original sample and should not be less than four
times the MDL. The added analyte concentration should be the same
as that used in the laboratory fortified blank.
9.4.1.1 If the concentration of fortification is less than 25% of the
background concentration of the matrix the matrix recovery
should not be calculated.
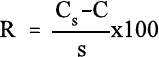
9.4.2 Calculate the percent recovery for each analyte, corrected for
concentrations measured in the unfortified sample, and compare these
values to the designated LFM recovery range 90-110%. Percent
recovery may be calculated using the following equation:
where, R = percent recovery
C = fortified sample concentration
s
C = sample background concentration
s = concentration equivalent of analyte added to sample

9.4.3 Until sufficient data becomes available (usually a minimum of 20-30
analysis), assess laboratory performance against recovery limits for
Method A of 80-120% and 75-125% for Method B. When sufficient
internal performance data becomes available develop control limits
from percent mean recovery and the standard deviation of the mean
recovery.
9.4.4 If the recovery of any analyte falls outside the designated LFM recovery
range and the laboratory performance for that analyte is shown to be in
control (Section 9.3), the recovery problem encountered with the LFM is
judged to be either matrix or solution related, not system related.
9.4.5 Where reference materials are available, they should be analyzed to
provide additional performance data. The analysis of reference samples
is a valuable tool for demonstrating the ability to perform the method
acceptably.
9.4.6 In recognition of the rapid advances occurring in chromatography, the
analyst is permitted certain options, such as the use of different
columns and/or eluents, to improve the separations or lower the cost of
measurements. Each time such modifications to the method are made,
the analyst is required to repeat the procedure in Section 9.2.
9.4.7 It is recommended that the laboratory adopt additional quality
assurance practices for use with this method. The specific practices that
are most productive depend upon the needs of the laboratory and the
nature of the samples. Field duplicates may be analyzed to monitor the
precision of the sampling technique. When doubt exists over the
identification of a peak in the chromatogram, confirmatory techniques
such as sample dilution and fortification, must be used. Whenever
possible, the laboratory should perform analysis of quality control
check samples and participate in relevant performance evaluation
sample studies.
9.4.8 At least quarterly, replicates of LFBs should be analyzed to determine
the precision of the laboratory measurements. Add these results to the
on-going control charts to document data quality.
9.4.9 When using Part B, the analyst should be aware of the purity of the
reagents used to prepare standards. Allowances must be made when
the solid materials are less than 99% pure.
10.0 CALIBRATION AND STANDARDIZATION
10.1 Establish ion chromatographic operating parameters equivalent to those
indicated in Tables 1A or 1B.
10.2 For each analyte of interest, prepare calibration standards at a minimum of
three concentration levels and a blank by adding accurately measured volumes
of one or more stock standards (Section 7.5) to a volumetric flask and diluting

to volume with reagent water. If a sample analyte concentration exceeds the
calibration range the sample may be diluted to fall within the range. If this is
not possible then three new calibration concentrations must be chosen, two of
which must bracket the concentration of the sample analyte of interest. Each
attenuation range of the instrument used to analyze a sample must be
calibrated individually.
10.3 Using injections of 0.1-1.0 mL (determined by injection loop volume) of each
calibration standard, tabulate peak height or area responses against the
concentration. The results are used to prepare a calibration curve for each
analyte. During this procedure, retention times must be recorded.
10.4 The calibration curve must be verified on each working day, or whenever the
anion eluent is changed, and after every 20 samples. If the response or
retention time for any analyte varies from the expected values by more than
±10%, the test must be repeated, using fresh calibration standards. If the
results are still more than ±10%, a new calibration curve must be prepared for
that analyte.
10.5 Nonlinear response can result when the separator column capacity is exceeded
(overloading). The response of the detector to the sample when diluted 1:1,
and when not diluted, should be compared. If the calculated responses are the
same, samples of this total anionic concentration need not be diluted.
11.0 PROCEDURE
11.1 Tables 1A and 1B summarize the recommended operating conditions for the
ion chromatograph. Included in these tables are estimated retention times that
can be achieved by this method. Other columns, chromatographic conditions,
or detectors may be used if the requirements of Section 9.2 are met.
11.2 Check system calibration daily and, if required, recalibrate as described in
Section 10.0.
11.3 Load and inject a fixed amount of well mixed sample. Flush injection loop
thoroughly, using each new sample. Use the same size loop for standards and
samples. Record the resulting peak size in area or peak height units. An
automated constant volume injection system may also be used.
11.4 The width of the retention time window used to make identifications should
be based upon measurements of actual retention time variations of standards
over the course of a day. Three times the standard deviation of a retention
time can be used to calculate a suggested window size for each analyte.
However, the experience of the analyst should weigh heavily in the
interpretation of chromatograms.
11.5 If the response for the peak exceeds the working range of the system, dilute
the sample with an appropriate amount of reagent water and reanalyze.

11.6 If the resulting chromatogram fails to produce adequate resolution, or if
identification of specific anions is questionable, fortify the sample with an
appropriate amount of standard and reanalyze.
Note: Retention time is inversely proportional to concentration. Nitrate and
sulfate exhibit the greatest amount of change, although all anions are affected
to some degree. In some cases this peak migration may produce poor
resolution or identification.
11.7 The following extraction should be used for solid materials. Add an amount
of reagent water equal to 10 times the weight of dry solid material taken as a
sample. This slurry is mixed for 10 minutes using a magnetic stirring device.
Filter the resulting slurry before injecting using a 0.45 µ membrane type filter.
This can be the type that attaches directly to the end of the syringe. Care
should be taken to show that good recovery and identification of peaks is
obtained with the user's matrix through the use of fortified samples.
11.8 It has been reported that lower detection limits for bromate (≈7 µg/L) can be
obtained using a borate based eluent
(7)
. The use of this eluent or other eluents
that improve method performance may be considered as a minor modification
of the method and as such still are acceptable.
11.9 Should more complete resolution be needed between peaks the eluent (7.3) can
be diluted. This will spread out the run but will also cause the later eluting
anions to be retained longer. The analyst must determine to what extent the
eluent is diluted. This dilution should not be considered a deviation from the
method.
12.0 DATA ANALYSIS AND CALCULATIONS
12.1 Prepare a calibration curve for each analyte by plotting instrument response
against standard concentration. Compute sample concentration by comparing
sample response with the standard curve. Multiply answer by appropriate
dilution factor.
12.2 Report only those values that fall between the lowest and the highest
calibration standards. Samples exceeding the highest standard should be
diluted and reanalyzed.
12.3 Report results in mg/L.
-
12.4 Report NO
2
as N
-
NO
3
as N
HPO
4
as P
13.0 METHODS PERFORMANCE
13.1 Tables 1A and 2A give the single laboratory (EMSL-Cincinnati) MDL for each
anion included in the method under the conditions listed.

13.2 Tables 2A and 2B give the single laboratory (EMSL-Cincinnati) standard
deviation for each anion included in the method in a variety of waters for the
listed conditions.
13.3 Multiple laboratory accuracy and bias data (S ) and estimated single operator
t
values (S ) for reagent, drinking and waste water using Method A are given
o
for each anion in Tables 3 through 9. Data from 19 laboratories were used for
this data.
13.4 Some of the bias statements, for example chloride and sulfate, may be
misleading due to spiking small increments of the anion into large naturally
occurring concentrations of the same anion.
14.0 POLLUTION PREVENTION
14.1 Pollution prevention encompasses any technique that reduces or eliminates the
quantity or toxicity of waste at the point of generation. Numerous
opportunities for pollution prevention exist in laboratory operation. The EPA
has established a preferred hierarchy of environmental management techniques
that places pollution prevention as the management option of first choice.
Whenever feasible, laboratory personnel should use pollution prevention
techniques to address their waste generation. When wastes cannot be feasibly
reduced at the source, the Agency recommends recycling as the next best
option.
14.2 Quantity of the chemicals purchased should be based on expected usage
during its shelf life and disposal cost of unused material. Actual reagent
preparation volumes should reflect anticipated usage and reagent stability.
14.3 For information about pollution prevention that may be applicable to
laboratories and research institutions, consult "Less is Better: Laboratory
Chemical Management for Waste Reduction," available from the American
Chemical Society's Department of Government Regulations and Science Policy,
1155 16th Street N.W., Washington, D.C. 20036, (202) 872-4477.
15.0 WASTE MANAGEMENT
15.1 The Environmental Protection Agency requires that laboratory waste
management practices be conducted consistent with all applicable rules and
regulations. Excess reagents, samples and method process wastes should be
characterized and disposed of in an acceptable manner. The Agency urges
laboratories to protect the air, water, and land by minimizing and controlling
all releases from hoods and bench operations, complying with the letter and
spirit of any waste discharge permit and regulations, and by complying with
all solid and hazardous waste regulations, particularly the hazardous waste
identification rules and land disposal restrictions. For further information on
waste management consult the "Waste Management Manual for Laboratory
Personnel", available from the American Chemical Society at the address listed
in Section 14.3.

16.0 REFERENCES
1. "Determination of Inorganic Disinfection By-Products by Ion Chromatography",
J. Pfaff, C. Brockhoff. J. Am. Water Works Assoc., Vol 82, No. 4, pg 192.
2. Standard Methods for the Examination of Water and Wastewater, Method
4110B, "Anions by Ion Chromatography", 18th Edition of Standard Methods
(1992).
3. Dionex, System 4000 Operation and Maintenance Manual, Dionex Corp.,
Sunnyvale, California 94086, 1988.
4. Method Detection Limit (MDL) as described in "Trace Analyses for
Wastewater", J. Glaser, D. Foerst, G. McKee, S. Quave, W. Budde,
Environmental Science and Technology, Vol. 15, Number 12, page 1426,
December, 1981.
5. American Society for Testing and Materials. Test Method for Anions in Water
by Chemically-Suppressed Ion Chromatography D4327-91. Annual Book of
Standards, Vol 11.01 (1993).
6. Code of Federal Regulations 40, Ch. 1, Pt. 136, Appendix B.
7. Hautman, D.P. & Bolyard, M. Analysis of Oxyhalide Disinfection By-products
and other Anions of Interest in Drinking Water by Ion Chromatography. Jour.
of Chromatog., 602, (1992), 65-74.
17.0 TABLES, DIAGRAMS, FLOWCHARTS AND VALIDATION DATA
TABLE 1A. CHROMATOGRAPHIC CONDITIONS AND DETECTION LIMITS
IN REAGENT WATER (PART A)
Analyte Peak #
*
Retention Time
(min)
MDL
(mg/L)
Fluoride 1 1.2 0.01
Chloride 2 1.7 0.02
Nitrite-N 3 2.0 0.004
Bromide 4 2.9 0.01
Nitrate-N 5 3.2 0.002
o-Phosphate-P 6 5.4 0.003
Sulfate 7 6.9 0.02
Standard Conditions:
Columns: as specified in Sesction 6.2.2.1
Detector:
as specified in Section 6.2.4 Pump Rate: 2.0 mL/min.
Eluent: as specified in Section 7.3 Sample Loop: 50 µL
MDL calculated from data system using a y-axis selection of 1000 ns and with a
stripchart recorder with an attenuator setting of 1 uMHO full scale.
*See Figure 1
TABLE 1B. CHROMATOGRAPHIC CONDITIONS AND DETECTION LIMITS
IN REAGENT WATER (PART B)
Analyte Peak #
*
Retention Time
(min)
MDL
(mg/L)
Chlorite 1 2.8 0.01
Bromate 2 3.2 0.02
Chlorate 4 7.1 0.003
Standard Conditions:
Column:
as specified in Section 6.2.2.2
Detector: as specified in Section 6.2.4 Pump Rate: 1.0 mL/min.
Eluent: as specified in Section 7.3 Sample Loop: 50 µL
Attentuation - 1
y-axis - 500 ns
*
See Figure 2

TABLE 2A. SINGLE-OPERATOR ACCURACY AND BIAS OF STANDARD ANIONS
(METHOD A)
Mean
Recovery
%
Standard
Deviation
(mg/L)
Sample
Type
Known Conc.
(mg/L)
Number
of Replicates Analyte
Bromide RW 5.0 7 99 0.08
DW 5.0 7 105 0.10
SW 5.0 7 95 0.13
WW 5.0 7 105 0.34
GW 5.0 7 92 0.34
SD 2.0 7 82 0.06
Chloride RW 20.0 7 96 0.35
DW 20.0 7 108 1.19
SW 10.0 7 86 0.33
WW 20.0 7 101 5.2
GW 20.0 7 114 1.3
SD 20.0 7 90 0.32
Fluoride RW 2.0 7 91 0.05
DW 1.0 7 92 0.06
SW 1.0 7 73 0.05
WW 1.0 7 87 0.07
GW 0.4 7 95 0.07
SD 5.0 7 101 0.35
Nitrate-N RW 10.0 7 103 0.21
DW 10.0 7 104 0.27
SW 10.0 7 93 0.17
WW 10.0 7 101 0.82
GW 10.0 7 97 0.47
SD 10.0 7 82 0.28
Nitrite RW 10.0 7 97 0.14
DW 10.0 7 121 0.25
SW 5.0 7 92 0.14
WW 5.0 7 91 0.50
GW 10.0 7 96 0.35
SD 2.0 7 98 0.08
o-Phosphate-P RW 10.0 7 99 0.17
DW 10.0 7 99 0.26
SW 10.0 7 98 0.22
WW 10.0 7 106 0.85
GW 10.0 7 95 0.33
Sulfate RW 20.0 7 99 0.40
DW 50.0 7 105 3.35
SW 40.0 7 95 1.7
WW 40.0 7 102 6.4
GW 40.0 7 112 3.2

TABLE 2A. SINGLE-OPERATOR ACCURACY AND BIAS OF STANDARD ANIONS
(METHOD A)
Mean
Recovery
%
Standard
Deviation
(mg/L)
Sample
Type
Known Conc.
(mg/L)
Number
of Replicates Analyte
RW = Reagent Water WW = Mixed Domestic and Industrial
Wastewater
DW = Drinking Water GW = Groundwater
SW = Surface Water SD = USEPA QC Solid (shale)

TABLE 2B. SINGLE-OPERATOR ACCURACY AND BIAS OF BY-PRODUCT
(PART B)
Analyte Type
Sample
(mg/L)
Spike
of Replicates
Number
%
Recovery
Mean
(mg/L)
Deviation
Standard
Bromide RW 5.0
1.0
0.1
0.05
7
7
7
7
103
98
155
122
0.07
0.04
0.005
0.01
DW 5.0
1.0
0.1
0.05
7
7
7
7
95
85
98
98
0.04
0.02
0.005
0.005
Chlorate RW 5.0
1.0
0.1
0.05
7
7
7
7
101
97
100
119
0.06
0.01
0.01
0.05
DW 5.0
1.0
0.1
0.05
7
7
7
7
101
115
121
110
0.04
0.01
0.005
0.01
Chlorite RW 5.0
1.0
0.1
0.05
7
7
7
7
100
98
86
94
0.04
0.01
0.01
0.01
DW 5.0
1.0
0.1
0.05
7
7
7
7
96
100
76
96
0.03
0.02
0.00
0.01
RW = Reagent Water
DW = Drinking Water

TABLE 3. MULTIPLE LABORATORY (n=19) DETERMINATION OF BIAS FOR
FLUORIDE
Amount
Added
mg/L
Amount Found
mg/L
Bias
% Water S
t
S
o
Reagent 0.26 0.25 0.08 0.11 -3.8
0.34 0.29 0.11 -14.7
2.12 2.12 0.07 0.12 0.0
2.55 2.48 0.14 -2.7
6.79 6.76 0.20 0.19 -0.4
8.49 8.46 0.30 -0.4
Drinking 0.26 0.24 0.08 0.05 -7.7
0.34 0.34 0.11 0.0
2.12 2.09 0.18 0.06 -1.4
2.55 2.55 0.16 0.0
6.79 6.84 0.54 0.25 +0.7
8.49 8.37 0.75 -1.4
Waste 0.26 0.25 0.15 0.06 -3.8
0.34 0.32 0.08 -5.9
2.12 2.13 0.22 0.15 +0.5
2.55 2.48 0.16 -2.7
6.79 6.65 0.41 0.20 -2.1
8.49 8.27 0.36 -2.6
TABLE 4. MULTIPLE LABORATORY (n=19) DETERMINATION OF BIAS FOR
CHLORIDE
Amount
Added
mg/L
Amount Found
mg/L
Bias
% Water S
t
S
o
Reagent 0.78 0.79 0.17 0.29 +1.3
1.04 1.12 0.46 +7.7
6.50 6.31 0.27 0.14 -2.9
7.80 7.76 0.39 -0.5
20.8 20.7 0.54 0.62 -0.5
26.0 25.9 0.58 -0.4
Drinking 0.78 0.54 0.35 0.20 -30.8
1.04 0.51 0.38 -51.0
6.50 5.24 1.35 1.48 -19.4
7.80 6.02 1.90 -22.8
20.8 20.0 2.26 1.14 -3.8
26.0 24.0 2.65 -7.7
Waste 0.78 0.43 0.32 0.39 -44.9
1.04 0.65 0.48 -37.5
6.50 4.59 1.82 0.83 -29.4
7.80 5.45 2.02 -30.1
20.8 18.3 2.41 1.57 -11.8
26.0 23.0 2.50 -11.5

TABLE 5. MULTIPLE LABORATORY (n=19) DETERMINATION OF BIAS FOR
NITRITE-NITROGEN
Amount
Added
mg/L
Amount
Found
mg/L
Bias
Water S
t
S
o
%
Reagent 0.36 0.37 0.04 0.04 +2.8
0.48 0.48 0.06 0.0
3.00 3.18 0.12 0.06 +6.0
3.60 3.83 0.12 +6.4
9.60 9.84 0.36 0.26 +2.5
12.0 12.1 0.27 +0.6
Drinking 0.36 0.30 0.13 0.03 -16.7
0.48 0.40 0.14 -16.7
3.00 3.02 0.23 0.12 +0.7
3.60 3.62 0.22 +0.6
9.60 9.59 0.44 0.28 -0.1
12.0 11.6 0.59 -3.1
Waste 0.36 0.34 0.06 0.04 -5.6
0.48 0.46 0.07 -4.2
3.00 3.18 0.13 0.10 +6.0
3.60 3.76 0.18 +4.4
9.60 9.74 0.49 0.26 +1.5
12.0 12.0 0.56 +0.3

TABLE 6. MULTIPLE LABORATORY (n=19) DETERMINATION OF BIAS FOR
BROMIDE
Amount
Added
mg/L
Amount
Found
mg/L
Bias
% Water S
t
S
o
Reagent 0.63 0.69 0.11 0.05 +9.5
0.84 0.85 0.12 +1.2
5.24 5.21 0.22 0.21 -0.6
6.29 6.17 0.35 -1.9
16.8 17.1 0.70 0.36 +1.6
21.0 21.3 0.93 +1.5
Drinking 0.63 0.63 0.13 0.04 0.0
0.84 0.81 0.13 -3.6
5.24 5.11 0.23 0.13 -2.5
6.29 6.18 0.30 -1.7
16.8 17.0 0.55 0.57 +0.9
21.0 20.9 0.65 -0.4
Waste 0.63 0.63 0.15 0.09 0.0
0.84 0.85 0.15 +1.2
5.24 5.23 0.36 0.11 -0.2
6.29 6.27 0.46 -0.3
16.8 16.6 0.69 0.43 -1.0
21.0 21.1 0.63 +0.3

TABLE 7. MULTIPLE LABORATORY (n=19) DETERMINATION OF BIAS FOR
NITRATE-NITROGEN
Amount
Added
mg/L
Amount
Found
mg/L
Bias
% Water S
t
S
o
Reagent 0.42 0.42 0.04 0.02 0.0
0.56 0.56 0.06 0.0
3.51 3.34 0.15 0.08 -4.8
4.21 4.05 0.28 -3.8
11.2 11.1 0.47 0.34 -1.1
14.0 14.4 0.61 +2.6
Drinking 0.42 0.46 0.08 0.03 +9.5
0.56 0.58 0.09 +3.6
3.51 3.45 0.27 0.10 -1.7
4.21 4.21 0.38 0.0
11.2 11.5 0.50 0.48 +2.3
14.0 14.2 0.70 +1.6
Waste 0.42 0.36 0.07 0.06 -14.6
0.56 0.40 0.16 -28.6
3.51 3.19 0.31 0.07 -9.1
4.21 3.84 0.28 -8.8
11.2 10.9 0.35 0.51 -3.0
14.0 14.1 0.74 +0.4

TABLE 8. MULTIPLE LABORATORY (n=19) DETERMINATION OF BIAS FOR
ORTHO-PHOSPHATE
Amount
Added
mg/L
Amount
Found
mg/L
Bias
% Water S
t
S
o
Reagent 0.69 0.69 0.06 0.06 0.0
0.92 0.98 0.15 +6.5
5.77 5.72 0.36 0.18 -0.9
6.92 6.78 0.42 -2.0
18.4 18.8 1.04 0.63 +2.1
23.1 23.2 0.35 +2.4
Drinking 0.69 0.70 0.17 0.17 +1.4
0.92 0.96 0.20 +4.3
5.77 5.43 0.52 0.40 -5.9
6.92 6.29 0.72 -9.1
18.4 18.0 0.68 0.59 -2.2
23.1 22.6 1.07 -2.0
Waste 0.69 0.64 0.26 0.09 -7.2
0.92 0.82 0.28 -10.9
5.77 5.18 0.66 0.34 -10.2
6.92 6.24 0.74 -9.8
18.4 17.6 2.08 1.27 -4.1
23.1 22.4 0.87 -3.0

TABLE 9. MULTIPLE LABORATORY (n=19) DETERMINATION OF BIAS FOR
SULFATE
Amount
Added
mg/L
Amount
Found
mg/L
Bias
% Water S
t
S
o
Reagent 2.85 2.83 0.32 0.52 -0.7
3.80 3.83 0.92 +0.8
23.8 24.0 1.67 0.68 +0.8
28.5 28.5 1.56 -0.1
76.0 76.8 3.42 2.33 +1.1
95.0 95.7 3.59 +0.7
Drinking 2.85 1.12 0.37 0.41 -60.7
3.80 2.26 0.97 -40.3
23.8 21.8 1.26 0.51 -8.4
28.5 25.9 2.48 -9.1
76.0 74.5 4.63 2.70 -2.0
95.0 92.3 5.19 -2.8
Waste 2.85 1.89 0.37 0.24 -33.7
3.80 2.10 1.25 -44.7
23.8 20.3 3.19 0.58 -14.7
28.5 24.5 3.24 -14.0
76.0 71.4 5.65 3.39 -6.1
95.0 90.3 6.80 -5.0