GAW Precipitation Chemistry Manual –Laboratory Operations- Conductivity (27 December 2018)
1
Abstracted from Laboratory Operations, Pg. 53, Section 4.5.5. Chloride, Nitrate, and
Sulfate by Ion Chromatography
Prepared by Nancy Lance, Toronto, Canada
Adapted by Van Bowersox, Quality Assurance - Science Activity Centre
Chloride, Nitrate, and Sulfate by Ion Chromatography
Go To: Calibration, Quality Control, Procedures, Troubleshooting
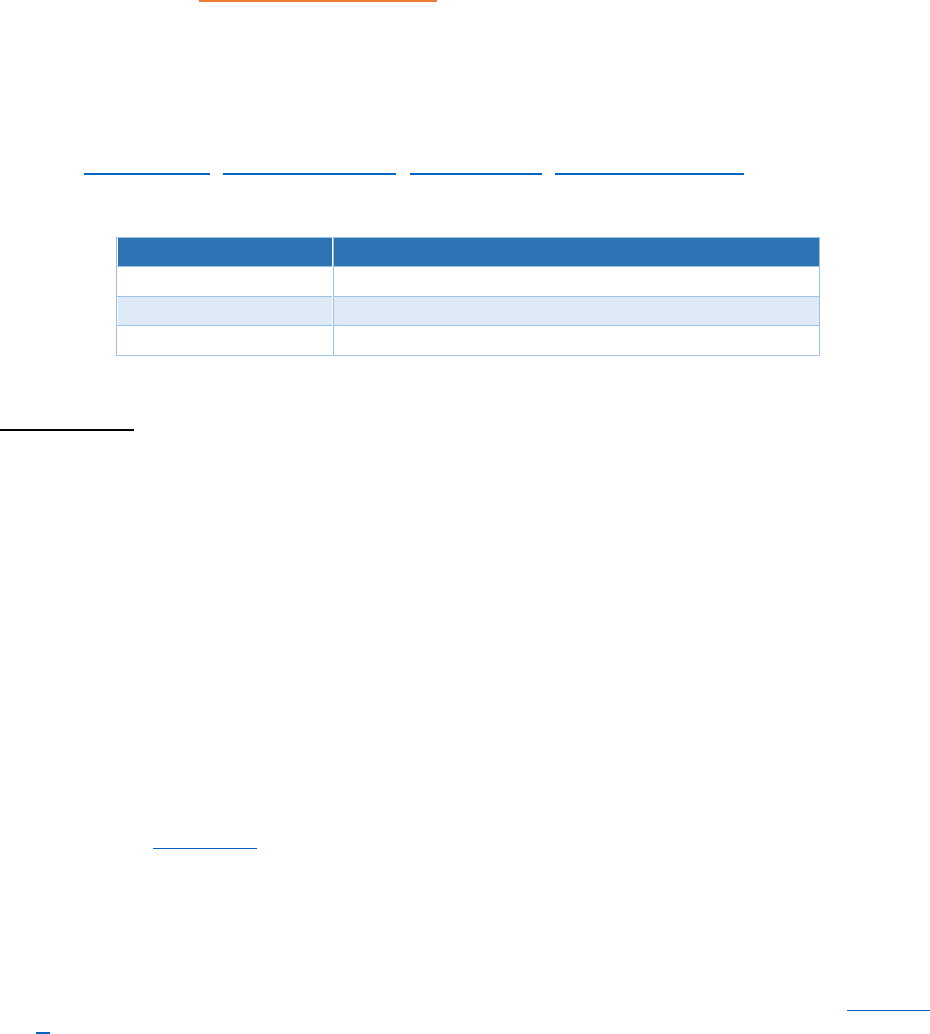
Table 4.12. Operating range of anions in precipitation
Analyte
Concentration Range (mgL
-1
)
Chloride
0.005 to 7.00
Nitrate
0.005 to 12.50
Sulfate
0.005 to 12.50
Calibration
Reagents and Solutions
i. Self-regenerating systems only require an eluent generation cartridge.
ii. Ultra-pure Type I DI water (resistivity >18MΩ).
Stock Standard Solutions
Stock standard solutions each containing 1000 mg L
-1
of chloride, nitrate and sulfate either may be
purchased as certified solutions or prepared from high purity salts. When preparing the standard solutions
from salts, be sure to dry the salts at 105
o
C for an hour before dissolving them in DI water and diluting to
1000 mL. Table 4.13 lists the masses of dried salts to use in preparing stock standard solutions.
New flasks and bottles used as containers for stock standard solutions need to be conditioned. This is
done by soaking them in DI water over night, then rinsing them three times with DI water and drying them
in a warm oven. This conditioning only needs to be performed the first time that new containers are put
into service. See Appendix C for calibration procedures for flasks and analytical balances.
1) Weigh all volumes using an analytical balance. Rinse all weigh boats thoroughly. Use conditioned
HDPE bottles to store stock standard solutions. Use containers that are dedicated solely to standard
solution preparation and storage and not for other procedures.
2) Prepare standard solutions by weighing the DI water volume. Calibrate the receiving flasks by
dispensing DI water by weight into the flask and then marking the flask at the fluid line. See Appendix
C for details.
3) Make three stock solutions. Weigh each salt carefully into a calibrated and conditioned 1 L
volumetric flask. Mix and store in designated, conditioned HDPE bottles. Stable for one year.
4) To ensure consistency between old and new stock standard solutions, prepare a dilution of the
new stock standard solution and analyze it as an unknown, using old calibration standards to calibrate
the instrument. Here is a step-by-step procedure:
i. Into a rinsed weigh boat dispense 1 gm of new stock standard solution.
ii. Pour this solution into a clean, rinsed and calibrated 1 L volumetric flask.
GAW Precipitation Chemistry Manual –Laboratory Operations- Conductivity (27 December 2018)
2
iii. Using Type I DI water, rinse the weigh boat into the flask and fill the flask to the 1 L mark.
iv. Mix well then allow the solution to stand and equilibrate for at least one hour.
v. Analyze this new stock standard solution but calibrate the IC using the old calibration standards.
vi. Measurement should fall within the expected range of precision around 1.00 mg L
-1
.
vii. If this diluted stock standard solution meets the 1.00 mg L
-1
QC specification, transfer the full
strength (1000 mg L
-1
) new stock standard solution to an HDPE flask and store at 4
o
C. If this
specification is not met, discard the solution and start the preparation again. Remember to allow
the solution to stand (equilibrate) for one hour before analysis.
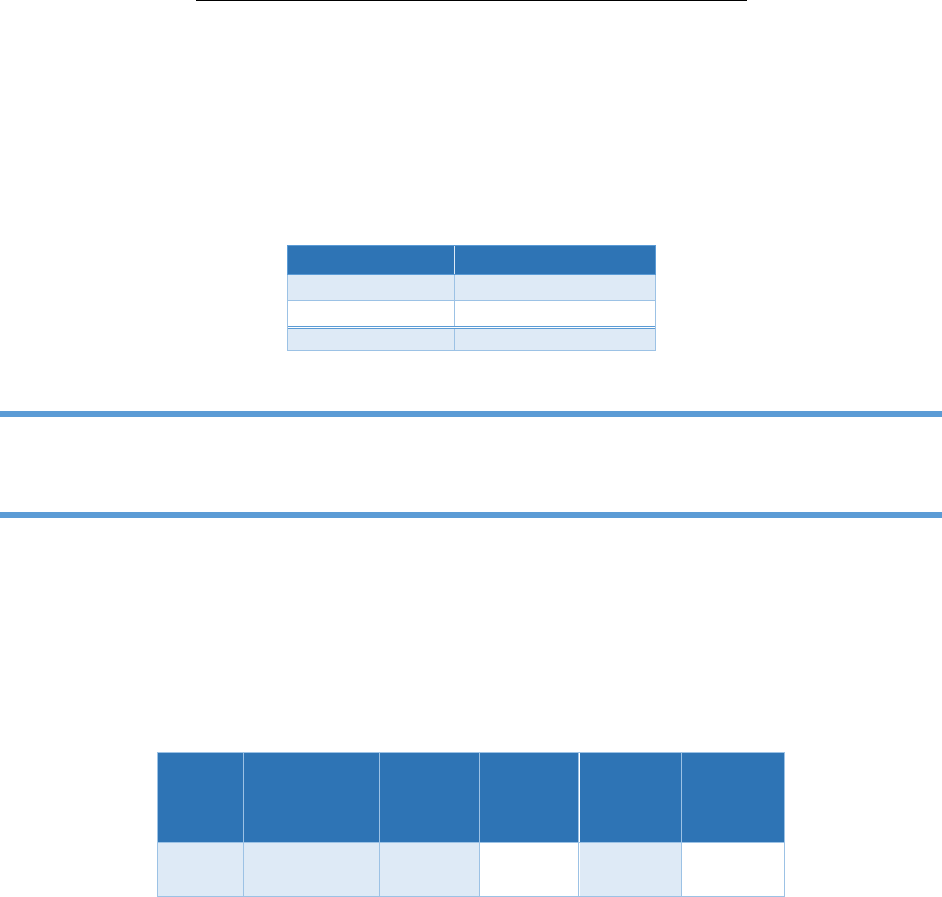
Table 4.13. Anion Stock Standard Solutions, Standard 1. The masses specified in the table result in 1000
mg L
-1
of Cl
-
, NO3
-
and SO
4
=
. (CAPMoN, 2013)
Salt
Weight (g)
NaCl
1.648
KNO
3
1.628
(NH
4
)
2
SO
4
1.375
Dispensing large volumes of stock solution to make working calibration standards is a
more accurate procedure than dispensing concentrated stock solutions in small volumes.
Low Working Standard1
1) Prepare Low Working Standard 1 (L-Std 1) by dispensing each stock standard solution by
weight into a calibrated, conditioned 1 L volumetric flask. The volumes are specified in table
4.14. Dilute to 1 L with DI water.
Table 4.14. Preparation of L-Std 1
Low
Std. #
Solution
Cl
-
(mL)
NO
3
-
(mL)
SO
4
2-
(mL)
Final
Volume
(mL)
1
Each stock
standard
0.500
1.250
1.250
1000
2) Use L-Std 1 to prepare low-range calibration standards 2 through 6, listed in table 4.16. All
flasks are conditioned, calibrated and designated for storing L-Std 1 solution.
High Working Standard1
1) Prepare High Working Standard 1 (H-Std 1) by dispensing each stock standard solution by weight
into a calibrated, conditioned 1 L volumetric flask. The volumes are specified in table 4.15. Dilute
to 1 L with DI water.
GAW Precipitation Chemistry Manual –Laboratory Operations- Conductivity (27 December 2018)
3
Table 4.15. Preparation of H-Std 1
High
Std. #
Solution
Cl
-
(mL)
NO
3
-
(mL)
SO
4
2-
(mL)
Final
Volume
(mL)
1
Each stock
Standard
7.000
12.500
12.500
1000
2) Use H-Std 1 to prepare high-range calibration standards 2 through 5, listed in able 4.17. All
flasks are conditioned,
calibrated and designated for storing H-Std 1
.
IC system software should be capable of addressing two calibration ranges (low and
high) in one analytical run.
Run all samples in the low calibration range and for values above the low range, use the
high calibration range. Only dilute samples with concentrations above the high range.
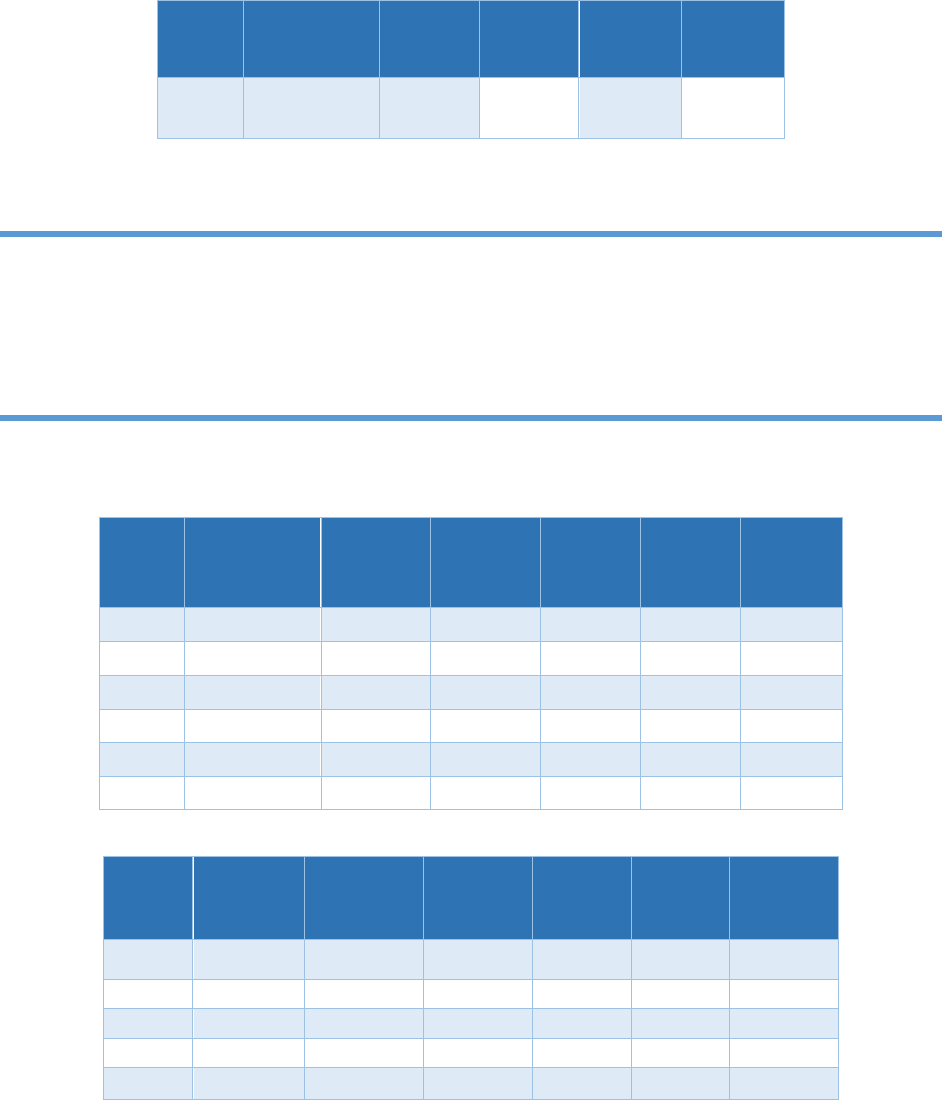
Table 4.16. Example of low range anion calibration standards (CAPMoN, 2013)
Low
Std. #
Solution
Volume
(mL)
Final
Volume
(mL)
Cl
-
(mg L
-1
)
NO
3
-
(mg L
-1
)
SO
4
2-
(mg L
-1
)
1
stock
0.500
1.250
1.250
2
L Std. 1
175
250
0.350
0.875
0.875
3
L Std. 1
125
250
0.250
0.625
0.625
4
L Std. 1
75
250
0.150
0.375
0.375
5
L Std. 1
40
250
0.080
0.200
0.200
6
L Std. 1
12.5
250
0.025
0.063
0.063
Table 4.17. Example of high range anion calibration standards (CAPMoN, 2013)
High
Std. #
Solution
Volume
(mL)
Final
Volume
(mL)
Cl
-
(mgL
-1
)
NO
3
-
(mgL
-1
)
SO
4
2-
(mgL
-1
)
1
Stock
7.000
12.500
12.500
2
H Std. 1
175
250
4.900
8.750
8.750
3
H Std. 1
90
250
2.520
4.500
4.500
4
H Std. 1
45
250
1.260
2.250
2.250
5
H Std. 1
25
250
0.700
1.250
1.250
Working standard Solutions
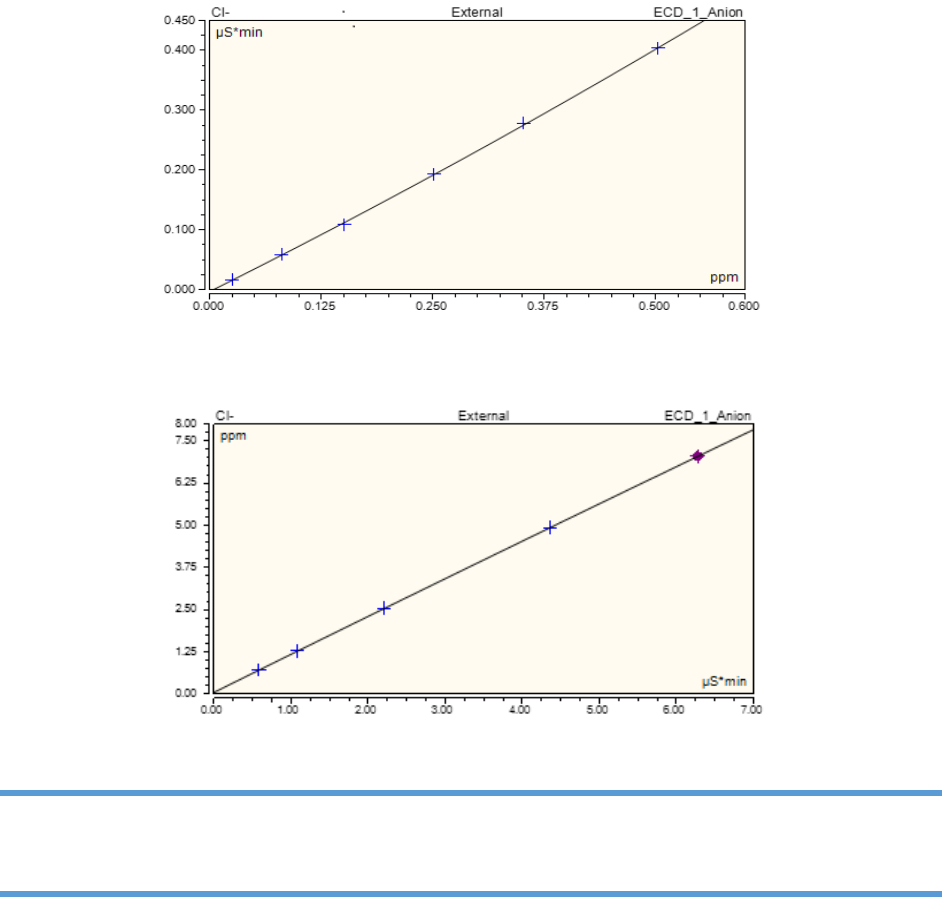
A minimum of five calibration standards per calibration curve is recommended. IC curves are not linear
and often do not go through zero. Most IC workstations allow for an unlimited number of standards. To
GAW Precipitation Chemistry Manual –Laboratory Operations- Conductivity (27 December 2018)
4
minimize the biases due to this nonlinearity, prepare IC curves in two sections: a low calibration range
and a high calibration range (see figures 4.23 and 4.24). This is very important so that the calibration
curves do not extend to concentrations where the results become skewed due to nonlinearity.
Figure 4.23. Low calibration curve for chloride
Figure 4.24. High calibration curve for chloride
Integrate chromatography data using peak area. Most IC curves are not linear and are
best described by a quadratic fit.
Measure all samples against the low calibration standards. Results that exceed the low calibration range
are read using the high calibration range. Sample concentrations that exceed high calibration limits must
be diluted and reanalyzed. Never extrapolate the calibration curve to estimate results. The ranges of
measured anion concentrations must be established by each individual laboratory and may vary over
time.
Calibration standards may be stored in clean HDPE containers at room temperature and are stable for up
to six weeks.

GAW Precipitation Chemistry Manual –Laboratory Operations- Conductivity (27 December 2018)
5
Quality Control
Preparing QC Solutions
Prepare two QC solutions, one for the low calibration range and one for the high calibration range.
Analyze a low QC sample immediately after the IC is calibrated in the low range. Do the same in the high
calibration range using the high QC solution. See Appendix C for details on sterilization and preparation
of QC solutions.
Low QC Solutions – Precipitation Matrix
1) Save the excess volume from low-concentration precipitation samples that have been analyzed and
reported. Pool the excess precipitation from some of these samples into a 10 L HDPE container and
the excess from other samples into a second 10 L HDPE container.
2) Analyze the pooled samples from each container. Examine the results and designate the pooled
sample with the lower concentration for each analyte as QC-A and the other pooled sample as QC-B.
3) Add DI water as needed to bring the concentration of QC-A near the detection limit. Add 1000 mg L
-1
stock solution as needed to bring the concentration of QC-B to the mid to high range of the low
calibration curve.
4) See Appendix C for sterilization and further details.
High QC Solutions – Precipitation Matrix
1) Save the excess volume from high-concentration precipitation samples that have been analyzed
and reported. Pool the excess precipitation from some of these samples into a 10 L HDPE
container and the excess from other samples into a second 10 L HDPE container.
2) Analyze the pooled samples from each container. Designate one of the pooled samples as QC-C
and the other as QC-D.
3) Add 1000 mg L
-1
stock solution as needed to bring the concentration of QC-C to the low to mid-
range of the high calibration curve and QC-D to the mid to high range of the high calibration
curve. Avoid a concentration that is higher than the highest calibration standard.
4) See Appendix C for sterilization and further details.
Analytical Procedures
1) Do not power down an IC system when not in use. Always leave the power on.
2) Check reagent levels. Check the fluid and ion percent in the eluent cartridge and ensure there is
adequate eluent for a full run. Change the DI water in the flush reservoir of the sample changer
every day. Inline filters may be used to minimize the introduction of particulate matter into the
system. Change inline filters daily.
3) Run DI water samples until the system is stable and equilibrated.
4) Label each tube. Prepare a schedule of analysis in the workstation software. Enter sample
identification numbers into the software in the same order as the tubes will be installed in the
sample changer rack.

GAW Precipitation Chemistry Manual –Laboratory Operations- Conductivity (27 December 2018)
6
5) Prepare samples for analysis. Make sure that each tube has a minimum volume. Minimum
volumes will vary according to injection loop size and loop rinse. Cover each tube opening with
Parafilm® or with a cap that can be pierced. Place the tubes in order in the sample changer rack.
6) Check for a stable pump pressure and conductivity.
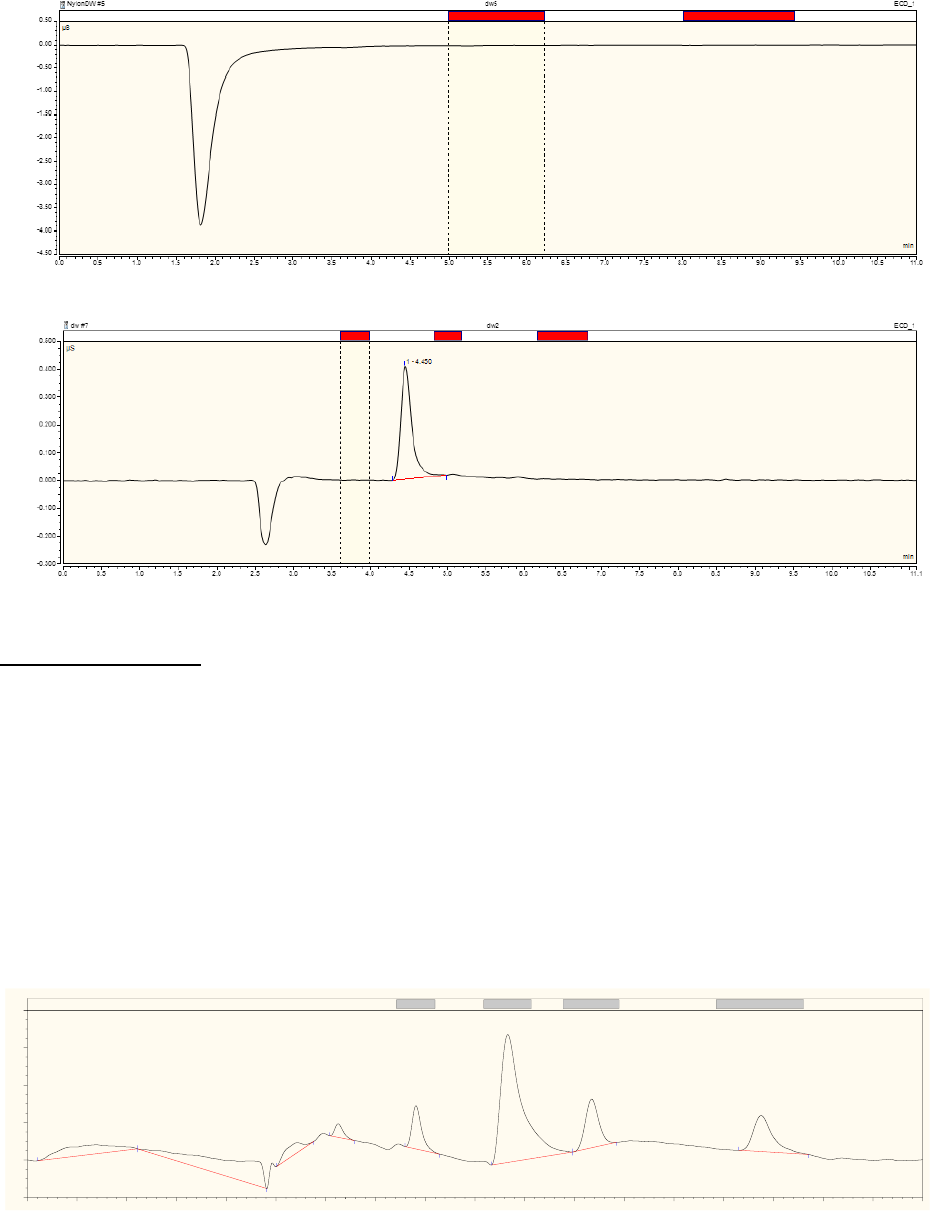
7) Check the DI water chromatograms for the correct shape. The shape of the chromatogram
depends on the eluent type. (a) When a carbonate eluent is used, the chromatogram will have a
water dip usually two to three minutes into the chromatogram. The water dip occurs right before
the chloride peak. See Figure 4.23 for the DI water chromatogram using carbonate eluent. Note
that the scale on the Y-axis is -4.50 to 0.800. (b) When the KOH eluent is used, the water dip is
much smaller. See Figure 4.24 for the DI water chromatogram using KOH eluent. Note that the
scale on the Y-axis is -0.300 to 0.800. Note also that the DI water chromatogram has a carbonate
peak positioned after chloride and before sulfate. The height of the carbonate peak will depend
on water quality, the age of the water and ambient room carbon dioxide levels. DI water
chromatograms must be free of the anions of interest before starting the analytical run.
8) Start the run. Run calibration standards first. The injection should start with the highest
concentration standard followed by decreasing concentrations.
9)
Run a low QCS directly after completing the low calibration curve and a high QCS after
completing the high calibration curve. Inject a QCS (randomly selected, high or low) every
ten samples thereafter. Plot the QCS results on control charts.
10) Calibrate every 30 to 50 samples.
11) Following the run, check all calibration curves and QCS results before reporting, collating or
tabulating sample results. Use only the peak area, not the peak height, for calculating results.
12) Examine each chromatogram individually for correct shape and integration. The baseline must
not drift up or down and must not be bumpy. All carbonate chromatograms should have a water
dip and all hydroxyl chromatograms should have a carbonate peak. The peaks should all have a
typical Gaussian shape and show good separation from each other. Comment on all anomalies
and flag data accordingly. Repeat samples that have drifting or bumpy baselines after resolving
the cause. See Troubleshooting, below.
Note that IC software uses peak ‘windows’. The software expects the peak for each analyte to
elute in a certain window of time. Peaks that fall outside this window will not be integrated. Also,
very large peaks that fill the window may not be recognized and thus produce a zero result.
Make note of these exceptions and repeat the analysis.
13) Calculate the final results against the appropriate calibration curve. Use the correct decimal
places. Apply detection limit notations as needed. Mark all samples that exceed the upper
calibration ranges. Dilute these samples and repeat the analysis. Account for any missing
samples and ensure contamination codes are applied as needed.
14) Export the data from the IC system and archive all parameters associated with the analysis,
including calibration data, integration data, and instrument audit trails. Audit trails include
instrument parameters (e.g. pump pressure) that may be useful in diagnosing a problem, such as
a chromatogram with a drifting baseline. It may be necessary to repeat the analysis at the point
where the problem began.
GAW Precipitation Chemistry Manual –Laboratory Operations- Conductivity (27 December 2018)
7
Figure 4.23. Deionized water chromatogram using carbonate eluent
Figure 4.24. Deionized water chromatogram using KOH eluent
Troubleshooting
Problem 1: Pump loses pressure or prime.
Solution 1: Check the EluGen
®
cartridge for leaks. Change the cartridge if required. Prime the pump.
Check the system for leakage. Re-prime the pump and run DI water to check the system. If the pump is
still unstable, disconnect the column and pump methanol through the system. Flush with water. If these
steps do not eliminate the problem, change the piston seals (provided the operator has been trained to do
so). Soak the piston seals in methanol for a few minutes. This ensures a better seal around the piston.
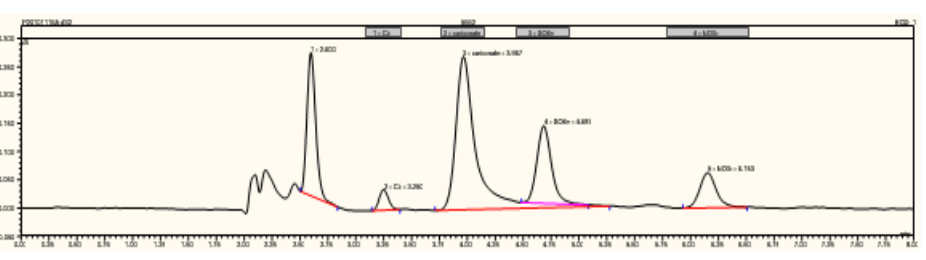
Problem 2: Rough or drifting baseline (Figure 4.25)
Solution 2: Microbore systems take longer to stabilize. Wait several hours before attempting to resolve
the problem. If the baseline doesn’t’ stabilize, recondition the suppressor. The reconditioning procedure is
the same as the procedure used to condition new suppressors prior to installation. Instructions are in the
suppressor packaging. Replace the suppressor if reconditioning does not work.
Figure 4.25. Rough baseline
0.00 0.50 1.00 1.50 2.00 2.50 3.00 3.50 4.00 4.50 5.00 5.50 6.00 6.50 7.00 7.50 8.00 8.50 9.00
-0.100
-0.000
0.100
0.200
0.300
0.400
P20110201A #6 [modified by capmonlab]
lo_cal6
ECD_1
µS
min
1 - 0.693
2 - 1.110
3 - 2.880
4 - 3.123
5 - Cl- - 3.907
6 - carbonate - 4.830
7 - SO4= - 5.673
8 - NO3- - 7.377
1 - Cl-
2 - carbonate
3 - SO4=
4 - NO3-
GAW Precipitation Chemistry Manual –Laboratory Operations- Conductivity (27 December 2018)
8
Problem 3: Precision not meeting QC specifications.
Solution 3: Check the injection valve for leaks or blocks. Make sure the sample loop is filling with each
injection. The sample loop should rinse about ten times with sample to ensure that there is absolutely no
mixing of a sample with the previous sample or with rinsate. Check this by placing the sample loop waste
line from the injection valve into a graduated cylinder. Introduce a sample from the sample changer. The
volume collected in the cylinder should be about ten times the injection loop volume.
Problem 4: Loss of precision.
Solution 4: Check the injection valve for leaks or blocks. Check the probe and sample lines for plugs or
leaks. Change the sample loop and clean the injection valve. A plug can be found by disconnecting each
length of tubing one section at a time. The pump pressure will increase significantly if the bed supports or
guard column is fouled.
Problem 5: Low sulfate values but other species in same sample are within expected range.
Solution 5: Change the sample changer probe and all sample delivery lines.
Problem 6: Anion that elutes with a retention time similar to chloride, sulfate or nitrate, potentially
interfering with the signal for one of these anions. See example in Figure 4.26.
Solution 6: Resolve the peak using the IC integration software, if possible, otherwise try running the
sample with less concentrated eluent. Protocols describing a corrective action should be described in the
standard operating procedure.
Problem 7: Retention times get shorter and the resolution is poor. Peaks fall short of their expected
windows and retention times. Pump pressure increases.
Solution 7: Clean or change the guard column. If there is no improvement clean or change the separator
column.
Figure 4.26. Chromatogram from KOH eluent system. Note crowding of carbonate and sulfate peaks,
where the sulfate is lifted off the baseline by the shoulder on the carbonate peak. Note that the organic
acids eluting early in the chromatogram are also crowded together and unresolved.
Problem 8: Several chromatograms in a row have no water dip (carbonate eluent) or carbonate peak
(KOH eluent). Chromatograms have no peaks for any anions.
Solution 8: Check the probe for plugs. Check the sample lines for plugs right up to the injection valve
and then check the injection loop for blocks.
Problem 9: Species elute too late and are seen eluting in the following chromatogram.
Solution 9: Extend the run time. Sometimes the run times and retention times can lengthen significantly
when new columns are put into service. It is important to test the system with calibration standards to sort
out where the new retentions occur.

GAW Precipitation Chemistry Manual –Laboratory Operations- Conductivity (27 December 2018)
9
Tips to Improve IC Performance
1. Develop a maintenance program and keep a log book that records maintenance procedures.
Keep track of instrument breakdowns and actions taken to resolve the problem.
2. Perform a complete system preventative maintenance once a year. Change interconnecting
tubing, change pump and piston seals, and calibrate the conductivity cell. Injection valve stators
should be inspected for wear and changed as required.
3. Use smaller bore columns to increase system efficiency. Modern IC pump systems can be
converted to micro-bore without changing the pump.
4. Do not reuse ferrules when changing connecting tubing. Ferrules tighten and restrict flow in
PEEK tubing, increasing the system pressure. Keep a log book of calibration standard details.
Record dates that standards are prepared. Show calculations, weights, and volumes. Record the
name of the person who prepared the solutions.
5. Calibrate glassware by mass. See Appendix C for details.
6. Mark maintenance periods, eluent cartridge changes, and new calibration solutions on quality
control charts and in log books to track potential shifts in control chart data.
7. Calibration solutions require dedicated glassware and containers. Do not use these containers for
any other purpose. Condition containers by soaking them overnight in deionized water or in the
solution that the container will hold.
8. Do not run contaminated or hard water samples using the same columns as precipitation.
9. Cover samples using caps that can be pierced or use Parafilm®. Keep the area clean.
10. Use calibration ranges typical of sample concentrations.
11. If very concentrated samples must be analyzed, reduce the length of the sample loop to minimize
column overload or use a higher standard range.
12. Increase sample loop length to increase sensitivity. This increases the injection volume.
Experiment with different lengths to optimize the system without overloading the columns.
13. Use inline filters to keep bacteria out of the system.
14. Change bed supports and guard columns as a first step when system pressures increase.
References
CAPMoN (2013, Dec). Chloride, Nitrate and Sulphate in Precipitation by Ion Chromatography- SOP 15.
Canadian Air and Precipitation Monitoring Network (CAPMoN) National Laboratory Standard
Operating Procedure. Toronto, ON, Canada.
