
9056A - 1 Revision 1
February 2007
METHOD 9056A
DETERMINATION OF INORGANIC ANIONS BY ION CHROMATOGRAPHY
SW-846 is not intended to be an analytical training manual. Therefore, method
procedures are written based on the assumption that they will be performed by analysts who are
formally trained in at least the basic principles of chemical analysis and in the use of the subject
technology.
In addition, SW-846 methods, with the exception of required method use for the analysis
of method-defined parameters, are intended to be guidance methods which contain general
information on how to perform an analytical procedure or technique which a laboratory can use
as a basic starting point for generating its own detailed Standard Operating Procedure (SOP),
either for its own general use or for a specific project application. The performance data
included in this method are for guidance purposes only, and are not intended to be and must
not be used as absolute QC acceptance criteria for purposes of laboratory accreditation.
1.0 SCOPE AND APPLICATION
1.1 This method addresses the sequential determination of chloride (ClG), fluoride (FG),
bromide (BrG), nitrate (NO
3
G), nitrite (NO
2
G), phosphate (PO
4
3
G), and sulfate (SO
4
2
G) anions in
aqueous samples, such as drinking water, wastewater, aqueous extracts of solids, and the
collection solutions from the bomb combustion of solid waste samples (Method 5050).
1.2 The lower limit of quantitation (LLOQ), the lowest concentration level that can be
measured within stated accuracy limits, varies for each individual analyte anion and as a
function of sample size.
1.3 Maximum column loading should not exceed approximately 500 ppm total anions
when using a 50-µL sample loop and the columns listed in Sec. 6.1. Dilution of samples may
allow higher concentration samples to be analyzed.
1.4 Analysts should consult the disclaimer statement at the front of the manual and
the information in Chapter Two for guidance on the intended flexibility in the choice of methods,
apparatus, materials, reagents, and supplies, and on the responsibilities of the analyst for
demonstrating that the techniques employed are appropriate for the analytes of interest, in the
matrix of interest, and at the levels of concern.
In addition, analysts and data users are advised that, except where explicitly specified in a
regulation, the use of SW-846 methods is not mandatory in response to Federal testing
requirements. The information contained in this method is provided by EPA as guidance to be
used by the analyst and the regulated community in making judgments necessary to generate
results that meet the data quality objectives for the intended application.
1.5 Use of this method is restricted to use by, or under supervision of, properly
experienced and trained personnel. Each analyst must demonstrate the ability to generate
acceptable results with this method.
9056A - 2 Revision 1
February 2007
2.0 SUMMARY OF METHOD
2.1 A small volume of aqueous sample is injected into an ion chromatograph to flush
and fill a constant-volume sample loop. The sample is then injected into a flowing stream of
carbonate-bicarbonate eluent.
2.2 The sample is pumped through two different ion exchange columns, then a
conductivity suppressor device, and into a conductivity detector. The two ion exchange
columns, a precolumn or guard column and a separator column, are packed with an anion
exchange resin. Ions are separated into discrete bands based on their affinity for the exchange
sites of the resin. The conductivity suppressor is an ion exchange-based device that reduces
the background conductivity of the eluent to a low or negligible level and simultaneously
converts the anions in the sample to their more conductive acid forms. The separated anions in
their acid forms are measured using an electrical conductivity cell. Anion identification is based
on the comparison of analyte signal peak retention times relative to those of known standards.
Quantitation is accomplished by measuring the peak area and comparing it to a calibration
curve generated from known standards.
3.0 DEFINITIONS
Refer to Chapter One, Chapter Three, and the manufacturer's instructions for definitions
that may be relevant to this procedure.
4.0 INTERFERENCES
4.1 Any species with a retention time similar to that of the desired anion will interfere.
Large quantities of ions eluting close to the anion of interest will also result in an interference.
Separation can be improved by adjusting the eluent concentration and/or flow rate. Sample
dilution and/or the use of the method of standard additions can also be used. For example, high
levels of organic acids that may interfere with inorganic anion analysis may be present in
industrial wastes. Two common species, formate and acetate, elute between fluoride and
chloride.
4.2 The water dip or negative peak that elutes near, and can interfere with, the fluoride
peak can usually be eliminated by the addition of the equivalent of 1 mL of concentrated eluent
(100 times more concentrated than the solution described in Sec. 7.3) to 100 mL of each
standard and sample.
4.3 Method interferences may be caused by contaminants in the reagent water,
reagents, glassware, and other sample processing apparatus that lead to discrete artifacts or
elevated baselines in ion chromatograms. All of these materials must be demonstrated to be
free from interferences under the conditions of the analysis by analyzing method blanks (Sec.
9.3.1). Specific selection of reagents and purification of solvents by distillation in all-glass
systems may be necessary. Refer to Chapter Three for general guidance on the cleaning of
glassware.
4.4 Samples that contain particles larger than 0.45 µm and reagent solutions that
contain particles larger than 0.20 µm require filtration to prevent damage to instrument columns
and flow systems. The associated method blanks must also be filtered if any samples or
reagents have undergone filtration.
9056A - 3 Revision 1
February 2007
4.5 The acetate, formate, and other monovalent organic acid anion elute early in the
chromatographic run and can interfere with fluoride. The retention times of anions may differ
when large amounts of acetate are present. Therefore, this method is not recommended for
leachates of solid samples where acetate is used for pH adjustment.
5.0 SAFETY
5.1 This method does not address all safety issues associated with its use. The
laboratory is responsible for maintaining a safe work environment and a current awareness file
of OSHA regulations regarding the safe handling of the chemicals listed in this method. A
reference file of material safety data sheets (MSDSs) should be available to all personnel
involved in these analyses.
5.2 The toxicity or carcinogenicity of each reagent used in this method has not been
fully established. Each chemical should be regarded as a potential health hazard and exposure
should be as low as reasonably achievable.
6.0 EQUIPMENT AND SUPPLIES
The mention of trade names or commercial products in this manual is for illustrative
purposes only, and does not constitute an EPA endorsement or exclusive recommendation for
use. The products and instrument settings cited in SW-846 methods represent those products
and settings used during method development or subsequently evaluated by the Agency.
Glassware, reagents, supplies, equipment, and settings other than those listed in this manual
may be employed provided that method performance appropriate for the intended application
has been demonstrated and documented.
This section does not list common laboratory glassware (e.g., beakers and flasks).
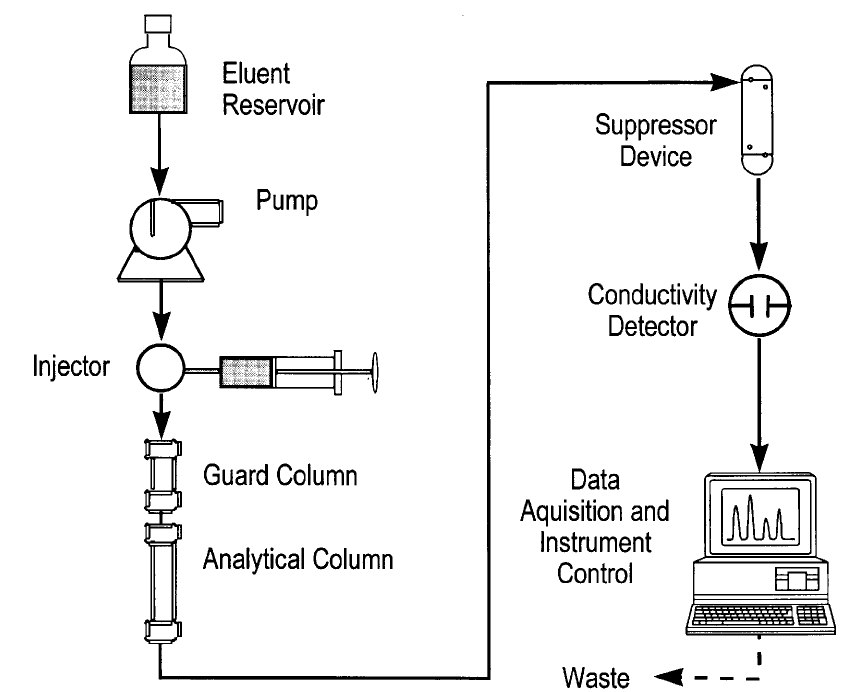
6.1 Ion chromatograph -- Capable of delivering 1 to 5 mL of eluent per min at a
pressure of 1000 to 4000 psi (6.5 to 27.5 MPa). The chromatograph must be equipped with an
injection valve, a 25- to 100-µL sample loop, and set up with the following components, as
schematically illustrated in Figure 1.
6.1.1 Precolumn -- A guard column placed before the separator column to
protect the separator column from being fouled by particulates or certain organic
constituents. An example of a suitable column is the Dionex IonPac
®
AG4A-SC, or
equivalent.
6.1.2 Separator (or analytical) column -- A column packed with an anion
exchange resin, suitable for resolving FG, BrG, ClG, NO
3
G, NO
2
G, PO
4
3
G, and SO
4
2
G. An
example of a suitable column is the Dionex IonPac
®
AS4A-SC, or equivalent.
6.1.3 Conductivity suppressor -- An ion exchange-based device that is capable
of converting the eluent and separated anions to their respective acid forms. Examples of
suitable suppressors include the Dionex AMMS-II or ASRS Ultra, or equivalent.
6.1.4 Conductivity detector -- A low-volume, flow-through, temperature-
compensated, electrical conductivity cell (approximately 1.25-µL volume), equipped with a
meter capable of reading from 0 to 1,000 Siemens/cm on a linear scale. An example of a
suitable conductivity detector is the Dionex CD20 or equivalent.
9056A - 4 Revision 1
February 2007
6.1.5 Pump -- Capable of delivering a constant flow of approximately 1 to 5
mL/min throughout the test and tolerating a pressure of 1000 to 4000 psi (6.5 to 27.5
MPa).
6.2 Syringe -- Minimum capacity of 1 mL, equipped with a male pressure fitting.
6.3 Appropriate chromatographic data and control software to acquire data. Dionex
PeakNet was used to record and process the chromatogram shown in Figure 2. Alternatively,
an integrator or recorder can be used to integrate the area under the chromatographic peaks. If
an integrator is used, the maximum area measurement must be within the linear range of the
integrator. The recorder should be compatible with the detector output with a full-scale
response time of 2 seconds or less.
6.4 Analytical balance -- Capable of weighing to the nearest 0.0001 g.
6.5 Pipets, Class A volumetric flasks, beakers -- Assorted sizes.
7.0 REAGENTS AND STANDARDS
7.1 Reagent-grade chemicals must be used in all tests. Unless otherwise indicated, it
is intended that all reagents conform to the specifications of the Committee on Analytical
Reagents of the American Chemical Society, where such specifications are available. Other
grades may be used, provided it is first ascertained that the reagent is of sufficiently high purity
to permit its use without lessening the accuracy of the determination.
7.2 Reagent water -- All references to water in this method refer to reagent water, as
defined in Chapter One.
7.3 Eluent, 1.7 mM NaHCO
3
/1.8 mM Na
2
CO
3
-- Dissolve 0.2856 g of sodium
bicarbonate (1.7 mM NaHCO
3
) and 0.3816 g of sodium carbonate (1.8 mM Na
2
CO
3
) in reagent
water and dilute to 2 L with reagent water or follow manufacturer’s guidance for the proper
eluent for each specific column.
7.4 Conductivity suppressor regenerant solution (25 mM H
2
SO
4
), if required -- Add 2.8
mL of concentrated sulfuric acid (H
2
SO
4
) to 4 L of reagent water.
7.5 Stock solutions (1,000 mg/L) -- Certified standards may also be purchased and
used as stock solutions. Stock solutions are stable for at least 1 month when stored at #6 EC.
7.5.1 Bromide stock solution (1.00 mL = 1.00 mg of BrG) -- Dry approximately 2
g of sodium bromide (NaBr) for 6 hr at 150 °C, and cool in a desiccator. Dissolve 1.2877 g
of the dried salt in reagent water, and dilute to 1 L with reagent water in a Class A
volumetric flask.
7.5.2 Chloride stock solution (1.00 mL = 1.00 mg of ClG) -- Dry sodium chloride
(NaCl) for 1 hr at 600 °C, and cool in a desiccator. Dissolve 1.6484 g of the dry salt in
reagent water, and dilute to 1 L with reagent water in a Class A volumetric flask.
7.5.3 Fluoride stock solution (1.00 mL = 1.00 mg of FG) -- Dissolve 2.2100 g of
sodium fluoride (NaF) in reagent water, and dilute to 1 L with reagent water in a Class A
volumetric flask. Store in a chemical-resistant glass or polyethylene container.

9056A - 5 Revision 1
February 2007
7.5.4 Nitrate stock solution (1.00 mL = 1.00 mg of NO
3
G) -- Dry approximately 2
g of sodium nitrate (NaNO
3
) at 105 °C for 24 hr. Dissolve exactly 1.3707 g of the dried salt
in reagent water, and dilute to 1 L with reagent water in a Class A volumetric flask.
7.5.5 Nitrite stock solution (1.00 mL = 1.00 mg of NO
2
G) -- Place approximately
2 g of sodium nitrate (NaNO
2
) in a 125 mL beaker and dry to constant weight (about 24 hr)
in a desiccator containing concentrated H
2
SO
4
. Dissolve 1.4998 g of the dried salt in
reagent water, and dilute to 1 L with reagent water in a Class A volumetric flask. Store in
a sterilized glass bottle. Refrigerate and prepare monthly.
NOTE
: Nitrite is easily oxidized, especially in the presence of moisture, and only fresh
reagents are to be used.
NOTE
: Prepare sterile bottles for storing nitrite solutions by heating them for 1 hr at 170
°C in an air oven.
7.5.6 Phosphate stock solution (1.00 mL = 1.00 mg of PO
4
3
G) -- Dissolve
1.4330 g of potassium dihydrogen phosphate (KH
2
PO
4
) in reagent water, and dilute to 1 L
with reagent water in a Class A volumetric flask.
7.5.7 Sulfate stock solution (1.00 mL = 1.00 mg of SO
4
2
G) -- Dissolve 1.4790 g
of the dried salt in reagent water, and dilute to 1 L with reagent water in a Class A
volumetric flask.
7.6 Anion calibration standards
Prepare a blank and at least three combination anion calibration standards containing the
anions of interest. The combination anion solutions must be prepared in Class A volumetric
flasks (see Table 2). Calibration standards should be prepared weekly, except for those that
contain nitrite and phosphate, which should be prepared fresh daily. The validity of standards
can be confirmed through the analysis of a freshly prepared ICV (Sec. 10.6).
7.6.1 Prepare the high-range calibration standard solution by combining the
volumes of each anion stock solution specified in Sec. 7.5 in a Class A volumetric flask
and diluting the mixture to 1 L with reagent water.
7.6.2 Prepare the intermediate-range calibration standard solution by diluting
10.0 mL of the high-range calibration standard solution (Sec. 7.6.1) to 100 mL with
reagent water.
7.6.3 Prepare the low-range calibration standard solution by diluting 20.0 mL of
the intermediate-range calibration standard solution (Sec. 7.6.2) to 100 mL with reagent
water.
8.0 SAMPLE COLLECTION, PRESERVATION, AND STORAGE
8.1 See the introductory material to Chapter Three, "Inorganic Analytes."
8.2 Preserve samples at #6 EC. If nitrite, nitrate and phosphate are analytes of
interest, samples should be analyzed within 48 hr of collection. A longer holding time may be
appropriate for chloride, fluoride, sulfate and bromide.
9056A - 6 Revision 1
February 2007
9.0 QUALITY CONTROL
9.1 Refer to Chapter One for guidance on quality assurance (QA) and quality control
(QC) protocols. When inconsistencies exist between QC guidelines, method-specific QC
criteria take precedence over both technique-specific criteria and those criteria given in Chapter
One, and technique-specific QC criteria take precedence over the criteria in Chapter One. Any
effort involving the collection of analytical data should include development of a structured and
systematic planning document, such as a Quality Assurance Project Plan (QAPP) or a Sampling
and Analysis Plan (SAP), which translates project objectives and specifications into directions
for those that will implement the project and assess the results. Each laboratory should
maintain a formal quality assurance program. The laboratory should also maintain records to
document the quality of the data generated. All data sheets and quality control data should be
maintained for reference or inspection.
9.2 Initial demonstration of proficiency
Each laboratory must demonstrate initial proficiency with the sample preparation and
determinative method combination it utilizes by generating data of acceptable accuracy and
precision for the target analyte in a clean matrix. The laboratory must also repeat the
demonstration of proficiency whenever new staff members are trained or significant changes in
instrumentation are made. See Method 8000 for information on how to accomplish an initial
demonstration of proficiency.
9.3 Sample quality control for preparation and analysis.
The laboratory must also have procedures for documenting the effect of the matrix on
method performance (precision, accuracy, method sensitivity). At a minimum, the laboratory
should include the analysis of QC samples including a method blank, a matrix spike, a
duplicate, and a laboratory control sample (LCS) in each analytical batch. Any method blanks,
matrix spike samples, replicate samples and LCSs should be subjected to the same analytical
procedures (Sec. 11.0) as those used on actual samples.
The following should be included within each analytical batch.
9.3.1 Initially, before processing any samples, the analyst should demonstrate
that all parts of the equipment in contact with the sample and reagents are
interference-free. This is accomplished through the analysis of a method blank. As a
continuing check, each time samples are extracted, cleaned up, and analyzed, and when
there is a change in reagents, a method blank should be prepared and analyzed for the
compounds of interest as a safeguard against chronic laboratory contamination. If a peak
is observed within the retention time window of any analyte that would prevent the
determination of that analyte, determine the source and eliminate it, if possible, before
processing the samples. The blanks should be carried through all stages of sample
preparation and analysis. If the method blank does not contain target analytes at a level
that interferes with the project-specific DQOs, then the method blank would be considered
acceptable.
In the absence of project-specific DQOs, if the blank is less than 10% of the lower
limit of quantitation check sample concentration, less than 10% of the regulatory limit, or
less than 10% of the lowest sample concentration for each analyte in a given preparation
batch, whichever is greater, then the method blank is considered acceptable. If the
method blank cannot be considered acceptable, the method blank should be re-run once,
and if still unacceptable, then all samples after the last acceptable method blank should be
reprepared and reanalyzed along with the other appropriate batch QC samples. These

9056A - 7 Revision 1
February 2007
blanks will be useful in determining if samples are being contaminated. If the method
blank exceeds the criteria, but the samples are all either below the reporting level or below
the applicable action level or other DQOs, then the sample data may be used despite the
contamination of the method blank. Refer to Chapter One for the proper protocol when
analyzing blanks.
9.3.2 A laboratory control sample (LCS) should be included with each
analytical batch. The LCS consists of an aliquot of a clean (control) matrix similar to the
sample matrix and of the same weight or volume. The LCS is spiked with the same
analytes at the same concentrations as the matrix spike, when appropriate. Acceptance
criteria should be set at a laboratory-derived limit developed through the use of historical
analyses, or set by the method quality objectives (MQOs)/data quality objectives (DQOs)
of the project. In the absence of historical data or well-defined MQOs/DQOs, this limit
should be set at ± 20% of the spiked value. Acceptance limits derived from historical data
must be no wider that ± 20%. Consult Method 8000 for further information on developing
acceptance criteria for the LCS. When the result of a matrix spike analysis indicates a
potential problem due to the sample matrix itself, the LCS result is used to verify that the
laboratory can perform the analysis in a clean matrix. If the LCS result is not acceptable,
then the LCS must be reanalyzed once. If the results are still unacceptable, then all
samples analyzed after the last acceptable LCS must be reprepared and reanalyzed.
9.3.3 Matrix spike, unspiked duplicate, or matrix spike duplicate (MS/Dup or
MS/MSD)
Documenting the effect of the matrix, for a given preparation batch consisting of
similar sample characteristics, should include the analysis of at least one matrix spike and
one duplicate unspiked sample or one matrix spike/matrix spike duplicate pair. The
decision on whether to prepare and analyze duplicate samples or a matrix spike/matrix
spike duplicate must be based on a knowledge of the samples in the sample batch or as
noted in the project-specific planning documents. If samples are expected to contain
target analytes, then laboratories may use one matrix spike and a duplicate analysis of an
unspiked field sample. If samples are not expected to contain target analytes, laboratories
should use a matrix spike and matrix spike duplicate pair.
9.3.3.1 At least one matrix spike (MS) sample should be analyzed
within each analysis batch for determining method bias and/or sample matrix
effects. The MS percent recovery (%R) is calculated as follows:
(
)
%
R
MSSR SR
SA
=
−
×
100
Where:
MSSR = MS Sample Result
SR = Sample Result
SA = Spike Added
When the sample concentration is less than the LLOQ, use SR = 0 for purposes of
calculating %R.
9.3.3.2 The method control limits for %R are 80 - 120. Alternate limits
may be used provided that they meet the data quality objectives of the specific
9056A - 8 Revision 1
February 2007
project. Failure to meet the MS %R criteria indicates potential problems with the
analytical system and/or sample matrix effects and corrective action should be
taken to investigate and resolve the problem. If %R is outside the control limits
and all other QC data is within limits, a matrix effect is suspected. The associated
data should be flagged according to project specifications or noted in the
comments section of the report.
9.3.3.3 A duplicate or matrix spike duplicate (MSD) should be
analyzed within every analytical batch in order to establish the precision of the
method. Calculate the relative percent difference (RPD) between the sample and
duplicate result as follows.
()
RPD
SD
SD
=
−
−
×
/2
100
Where:
RPD = Relative Percent Difference
S = Sample or MS Sample Result
D = Duplicate or MSD Result
9.3.3.4 The method control limit for RPD is 15% for all sample
concentrations that are near or above the mid-range of the calibration curve. The
method control limit for RPD is 50% for sample concentrations that are near the
low-range of the calibration curve. Alternate limits may be used provided that they
meet the data quality objectives of the specific project. Failure to meet the
duplicate RPD criteria indicates potential problems with the analytical system
and/or sample matrix effects and corrective action should be taken to investigate
and resolve the problem.
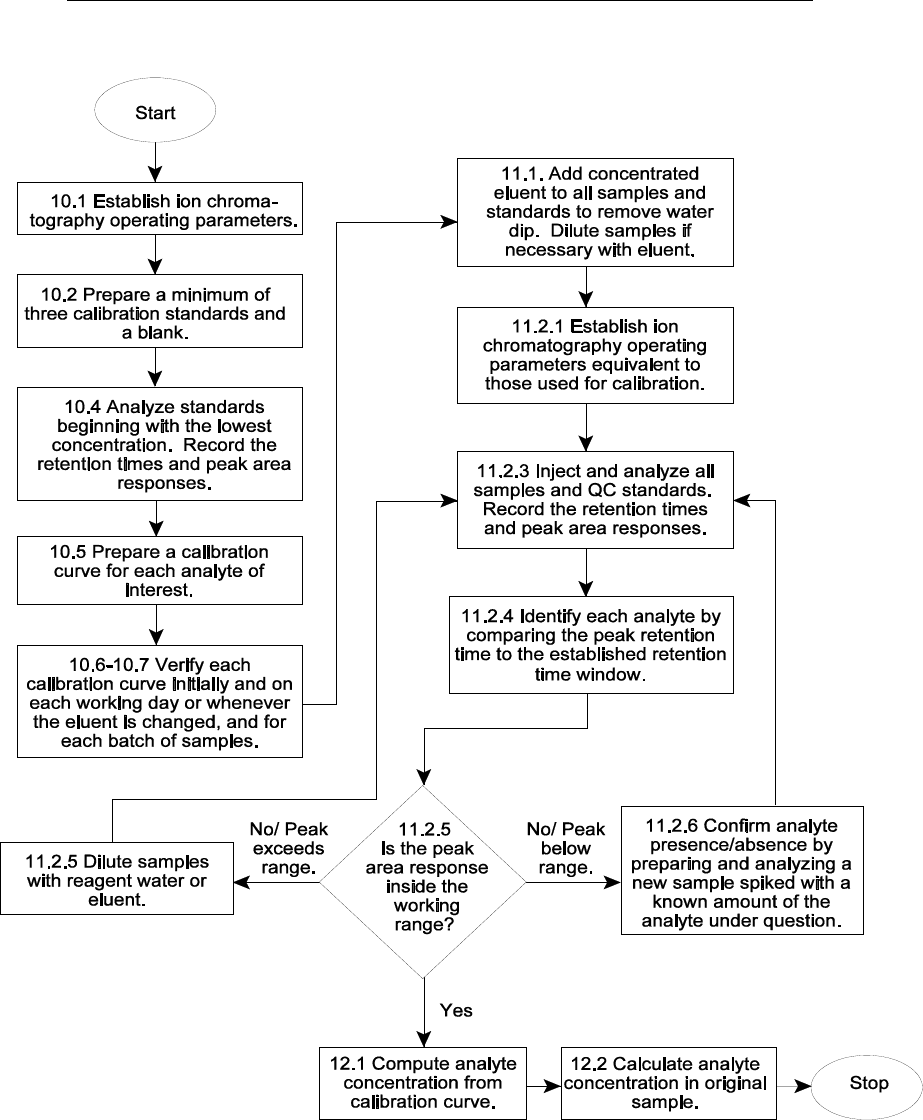
10.0 CALIBRATION AND STANDARDIZATION
10.1 Establish ion chromatographic operating parameters equivalent to those indicated
in Table 1, or as recommended by the manufacturer.
10.2 For each analyte of interest, prepare a blank and calibration standards at a
minimum of three concentrations by adding accurately measured volumes of one or more stock
standards to a Class A volumetric flask and diluting to volume with reagent water. A sufficient
number of standards must be analyzed to allow an accurate calibration curve to be established.
One of the standards should be representative of a concentration at or below the laboratory’s
lower limit of quantitation (LLOQ). The other standards should correspond to the range of
concentrations expected in the sample or should define the working range of the detector.
10.3 The laboratory should establish the LLOQ for each analyte as the lowest reliable
laboratory reporting concentration or in most cases the lowest point in the calibration curve
which is less than or equal to the desired regulatory action levels, based on the stated project
requirements. Analysis of a standard prepared at the LLOQ concentration levels or use of the
LLOQs as the lowest point calibration standard provides confirmation of the established
sensitivity of the method. The LLOQ recoveries must be within 50% of the true values to verify
the data reporting limit.
9056A - 9 Revision 1
February 2007
10.4 After a stable baseline is obtained (approximately 30 min), begin to inject
standards starting with the lowest concentration standard and increasing in concentration to the
highest standard. Use a fixed injection volume between 25 and 100 µL (determined by injection
loop volume) for each calibration standard. Record the peak area responses and retention
times for each analyte.
10.5 Establish the individual analyte calibration curves by plotting the peak area
responses for each standard against the corresponding concentrations. Use a least squares
-
linear regression to calculate the calibration curve formula. The linear correlation coefficient
should be equal to or greater than 0.995.
A weighted least squares regression may also be
performed using 1/concentration or 1/(concentration)
2
as the weighting factor. The acceptance
criterion for the calibration curve should be a correlation coefficient of 0.995 or higher. Refer to
Method 8000 for additional guidance on calibration procedures.
10.6 Verify the accuracy of the initial calibration curve by analyzing an initial calibration
verification (ICV) standard. The ICV standard must be prepared from an independent (second
source) material at or near the mid-range of the calibration curve. The acceptance criteria for
the ICV standard must be no greater than ± 10% of its true value. If the calibration curve cannot
be verified within the specified limits, the cause must be determined and the instrument
recalibrated before samples are analyzed. The analysis data for the ICV must be kept on file
with the sample analysis data.
10.7 Verify the accuracy of the working calibration curve on each working day, or
whenever the anion eluent composition or strength is changed, and for every batch of 10 or less
samples, through the analysis of a continuing calibration verification (CCV) standard. The CCV
should be made from the same material as the initial calibration standards at or near mid-range.
The acceptance criteria for the CCV standard should be ± 10% of its true value for the
calibration to be considered valid. If the CCV standard result does not meet the acceptance
criterion, sample analysis must be discontinued, the cause determined, and the instrument
recalibrated. All samples analyzed after the last acceptable CCV should be reanalyzed. The
analysis data for the CCV should be kept on file with the sample analysis data.
10.8 Nonlinear response can result when the separator column capacity is exceeded
(overloading). Maximum column loading should not exceed approximately 500 ppm total anions
when using a 50-µL sample loop and the columns listed in Sec. 6.1.
11.0 PROCEDURE
11.1 Sample preparation
When aqueous samples are injected, the water passes rapidly through the columns, and a
negative "water dip" is observed that may interfere with the early-eluting fluoride and/or chloride
ions. In combustate samples generated by bomb combustion (Method 5050), the water dip
should not be observed, since the collecting solution is a concentrated eluent solution that will
be equivalent to the eluent strength when diluted to 100-mL with reagent water according to the
bomb combustion procedure. Any dilutions required in analyzing other water samples should
be made with the eluent solution. The water dip, if present, may be removed by adding
concentrated eluent to all samples and standards such that the final sample/standard solution is
equivalent to the eluent concentration. When a manual system is used, it is necessary to
micropipet concentrated buffer into each sample. The recommended procedure follows:
11.1.1 Prepare a 100-mL stock of eluent 100 times a normal concentration by
dissolving 1.428 g of NaHCO
3
and 1.908 g of Na
2
CO
3
in 100 mL of reagent water or use
9056A - 10 Revision 1
February 2007
the manufacturer’s specified eluent. Cover or seal the volumetric flask.
11.1.2 Pipet 5 mL of each sample into a clean polystyrene micro-beaker.
Micropipet 50 mL of the concentrated buffer into the beaker and stir well.
11.1.3 Dilute the samples with eluent, if necessary, to concentrations within the
linear range of the calibration.
11.2 Sample analysis
11.2.1 Establish ion chromatographic operating parameters exactly equivalent to
those used for calibration (Sec. 10.0). Establish a stable baseline. This should take
approximately 30 min.
11.2.2 Establish a valid initial calibration or otherwise verify the working
calibration curve as outlined in Sec.10.0.
11.2.3 Inject a suitable volume of sample or QC standard into the IC instrument.
Use an injection volume that is optimal for the specific analytical column and instrument
system. The volume of sample injected must be consistent with that used for calibration
(Sec. 10.0). Record the resulting analyte peak sizes in area units as well as the peak
retention times.
11.2.4 For each sample or QC standard, identify each analyte by comparing the
peak retention time to the established retention time window. The width of the retention
time window used to make identifications should be based on measurements of actual
retention time variations of standards over the course of a day, and may include
concentrations from both ends of the calibration range. Three times the standard
deviation of a retention time may be used to calculate a suggested window size for a
compound. However, the experience of the analyst should weigh heavily in the
interpretation of chromatograms.
11.2.5 If the peak area response exceeds the working calibration range, then
dilute the sample with an appropriate amount of reagent water or eluent and reanalyze.
11.2.6 If the resulting chromatogram for a particular sample fails to produce
adequate resolution such that the identification of the anion of interest is questionable,
prepare a new sample spiked with a known amount of the anion under question and
reanalyze in order to confirm the presence or absence of analyte.
12.0 DATA ANALYSIS AND CALCULATIONS
12.1 Using the established calibration curve, compute the concentration of each analyte
in each analysis sample or QC standard based on the peak area response. Most
chromatography data analysis software systems perform such calculations automatically.
12.2 Calculate the concentration of analyte in the original sample as follows:
Final result (mg/L) = (C)(D)
Where:
C = Concentration from calibration curve (mg/L)
D = Dilution factor (if needed)
9056A - 11 Revision 1
February 2007
13.0 METHOD PERFORMANCE
13.1 Performance data and related information are provided in SW-846 methods only as
examples and guidance. The data do not represent required performance criteria for users of
the methods. Instead, performance criteria should be developed on a project-specific basis,
and the laboratory should establish in-house QC performance criteria for the application of this
method. These performance data are not intended to be and must not be used as absolute QC
acceptance criteria for purposes of laboratory accreditation.
13.2 Examples of single-operator accuracy and precision values for reagent, drinking,
and surface water, and mixed domestic and industrial waste water are listed in Table 3. See
EPA Method 300.0 for examples of multiple laboratory determinations of bias for the analytes
using an IonPac AS4A column, bicarbonate/carbonate eluent, AMMS suppressor and
conductivity detection (see Ref. 1). These data are provided for guidance purposes only.
13.3 Combustate samples
Tables 4 and 5 are based on 41 data points obtained by six laboratories, in which each
laboratory analyzed four used crankcase oils and three blends of fuel oil with crankcase oil.
Each analysis was performed in duplicate. The oil samples were combusted using Method
5050. Each point represents the duplicate analyses of a sample. One point was judged to be
an outlier and was not included in the results. These data are provided for guidance purposes
only.
14.0 POLLUTION PREVENTION
14.1 Pollution prevention encompasses any technique that reduces or eliminates the
quantity and/or toxicity of waste at the point of generation. Numerous opportunities for pollution
prevention exist in laboratory operations. The EPA has established a preferred hierarchy of
environmental management techniques that places pollution prevention as the management
option of first choice. Whenever feasible, laboratory personnel should use pollution prevention
techniques to address their waste generation. When wastes cannot be feasibly reduced at the
source, the Agency recommends recycling as the next best option.
14.2 The quantity of the chemicals purchased should be based on expected usage
during its shelf life and disposal cost of unused material. Actual reagent preparation volumes
should reflect anticipated usage and reagent stability.
14.3 For information about pollution prevention that may be applicable to laboratories
and research institutions consult Less is Better: Laboratory Chemical Management for Waste
Reduction available from the American Chemical Society's Department of Government
Relations and Science Policy, 1155 16th St., N.W. Washington, D.C. 20036, http://www.acs.org
.
15.0 WASTE MANAGEMENT
The Environmental Protection Agency requires that laboratory waste management
practices be conducted consistent with all applicable rules and regulations. The Agency urges
laboratories to protect the air, water, and land by minimizing and controlling all releases from
hoods and bench operations, complying with the letter and spirit of any sewer discharge permits
and regulations, and by complying with all solid and hazardous waste regulations, particularly
9056A - 12 Revision 1
February 2007
the hazardous waste identification rules and land disposal restrictions. For further information
on waste management, consult The Waste Management Manual for Laboratory Personnel
available from the American Chemical Society at the address listed in Sec. 14.2.
16.0 REFERENCES
1. Environmental Protection Agency, Environmental Monitoring Systems Laboratory, Office
of Research and Development, USEPA Method 300.0, "Determination of Inorganic Anions
by Ion Chromatography," EPA-600/R-93-100, August 1993.
2. Annual Book of ASTM Standards, Volume 11.01 Water, "Test Method for Anions in Water
by Chemically-Suppressed Ion Chromatography," D 4327-97, 1998.
3. Standard Methods for the Examination of Water and Wastewater, Method 4110,
"Determination of Anions by Ion Chromatography," 18th Edition of Standard Methods,
1992.
4. Dionex, DX-500 System Operation and Maintenance Manual, Dionex Corp., Sunnyvale,
CA 94086, 1996.
5. A. Gaskill, E. D. Estes, D. L. Hardison, and L. E. Myers, "Validation of Methods for
Determining Chlorine in Used Oils and Oil Fuels," prepared for U.S. Environmental
Protection Agency Office of Solid Waste, EPA Contract No. 68-01-7075, WA 80, July
1988.
17.0 TABLES, DIAGRAMS, FLOW CHARTS AND VALIDATION DATA
The following pages contain the tables and figures referenced by this method.
9056A - 13 Revision 1
February 2007
TABLE 1
EXAMPLE CHROMATOGRAPHIC CONDITIONS AND
RETENTION TIMES IN REAGENT WATER
Chromatographic Conditions
Columns See Secs. 6.1.1-6.1.2
Conductivity suppressor See Sec. 6.1.3
Conductivity detector See Sec. 6.1.4
Eluent See Sec. 7.3
Sample loop 50 µL
Pump flow rate 2.0 mL/min
Analyte Concentration of Mixed
Standard (mg/L)
Retention Time
(min)
a
Fluoride 2.0 1.2
Chloride 3.0 1.7
Nitrite-N 2.0 2.0
Nitrate-N 5.0 3.2
o-Phosphate-P 2.0 5.4
Sulfate 15.0 6.9
a
The retention time given for each anion is based on the equipment and analytical conditions
described in the method. Use of other analytical columns or different eluent concentrations will
affect retention times accordingly.
Data are taken from Ref. 1 and are provided for guidance purposes only.
9056A - 14 Revision 1
February 2007
TABLE 2
EXAMPLE STANDARD SOLUTIONS
FOR INSTRUMENT CALIBRATION
Analyte
Volume of Stock Solution
(in mL) used to prepare
High-Range Standard
1
Concentration in mg/L
High-
Range
Standard
Intermediate-
Range
Standard
Low-
Range
Standard
Fluoride (FG)10101.00.2
Chloride (ClG)10101.00.2
Nitrite (NO
2
G)20202.00.4
Phosphate (PO
4
3
G)50 505.01.0
Bromide (BrG)10101.00.2
Nitrate (NO
3
G)30303.00.6
Sulfate (SO
4
2
G) 100 100 10.0 2.0
1
Volumes of each stock solution (1.00 mL = 1.00 mg) that are combined in a Class A volumetric
flask and diluted to 1 L to prepare the high-range calibration standard (refer to Sec. 7.5).
These data are provided for guidance purposes only.

9056A - 15 Revision 1
February 2007
TABLE 3
EXAMPLE SINGLE-OPERATOR ACCURACY AND PRECISION
Analyte Sample Type Spike (mg/L) Mean Recovery (%) Std. Dev. (mg/L)
Chloride RW 0.050 97.7 0.0047
DW 10.0 98.2 0.289
SW 1.0 105.0 0.139
WW 7.5 82.7 0.445
Fluoride RW 0.24 103.1 0.0009
DW 9.3 87.7 0.075
SW 0.50 74.0 0.0038
WW 1.0 92.0 0.011
Nitrate-N RW 0.10 100.9 0.0041
DW 31.0 100.7 0.356
SW 0.50 100.0 0.0058
WW 4.0 94.3 0.058
Nitrite-N RW 0.10 97.7 0.0014
DW 19.6 103.3 0.150
SW 0.51 88.2 0.0053
WW 0.52 100.0 0.018
o-Phosphate-P RW 0.50 100.4 0.019
DE 45.7 102.5 0.386
SW 0.51 94.1 0.020
WW 4.0 97.3 0.04
Sulfate RW 1.02 102.1 0.066
DW 98.5 104.3 1.475
SW 10.0 111.6 0.709
WW 12.5 134.9 0.466
All data are taken from Ref. 1 and are based on the analyses of seven replicates. These data
are provided for guidance purposes only.
RW = Reagent water SW = Surface water
DW = Drinking water WW = Waste water
9056A - 16 Revision 1
February 2007
TABLE 4
EXAMPLE REPEATABILITY AND REPRODUCIBILITY DATA FOR CHLORINE IN
USED OILS BY BOMB OXIDATION AND ION CHROMATOGRAPHY ANALYSIS
Average Value (µg/g) Repeatability (µg/g) Reproducibility (µg/g)
500 467 941
1,000 661 1,331
1,500 809 1,631
2,000 935 1,883
2,500 1,045 2,105
3,000 1,145 2,306
Data are taken from Ref. 5 and are provided for guidance purposes only.
TABLE 5
EXAMPLE RECOVERY AND BIAS DATA FOR CHLORINE IN USED OILS BY
BOMB OXIDATION AND ION CHROMATOGRAPHY ANALYSIS
Amount Expected
(µg/g)
Amount Found
(µg/g)
Bias
(µg/g)
Bias
(%)
320 567 247 +77
480 773 293 +61
920 1,050 130 +14
1,498 1,694 196 +13
1,527 1,772 245 +16
3,029 3,026 -3 0
3,045 2,745 -300 -10
Data are taken from Ref. 5 and are provided for guidance purposes only.
9056A - 17 Revision 1
February 2007
FIGURE 1
SCHEMATIC OF ION CHROMATOGRAPHY INSTRUMENTATION
9056A - 18 Revision 1
February 2007
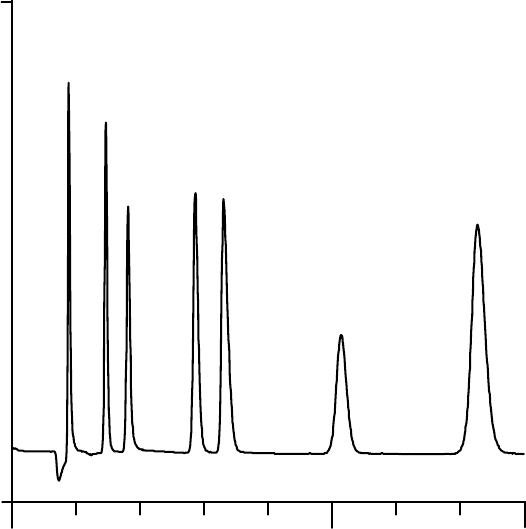
0.0 5.0
-2.0
10.0
uS
8.01.0 2.0 3.0 4.0 6.0 7.0
Minutes
Sulfate
o-Phosphate-P
Nitrate-N
Bromide
Nitrite-N
Chloride
Fluoride
FIGURE 2
EXAMPLE ANION PROFILE
This figure is provided for guidance purposes only.
9056A - 19 Revision 1
February 2007
METHOD 9056A
DETERMINATION OF INORGANIC ANIONS BY ION CHROMATOGRAPHY
